Plastic Oceans
slogan
The Challenge
??
My Role
UX Designer & Developer
User research, paper prototyping, development, usability testing, support
Tools
React.js, Firebase, D3, jQuery, Fetch API, Bootstrap, CSS
Duration
March 2018 - June 2018
Team
Vanessa Hsu, Alexis Koss, Jane Quichocho
Instructor
Andrew Begel
OVERVIEW
Many people are unaware of how much plastic they use and how this usage is affecting our world’s oceans and the marine life that inhabit them. This is mainly due to the fact that there are few applications that address the issue of plastic pollution in the ocean or monitor the amount of plastic a person uses every week. If we continue to ignore this problem, more marine life will be vulnerable to unnatural deaths due to entanglement or digestion of plastic.
Plastic Oceans is a mobile web application that brings awareness to the overuse of plastic that is endangering our oceans. This educates users on the impact of their plastic footprint while also giving them advice on how to reduce plastic waste.
THE PROBLEM
Many of us like to think of the ocean as a clear, blue, prosperous environment inhabited by an abundance of diverse marine life. Unfortunately, every year approximately 19 billion pounds of plastic waste end up in our oceans, causing massive plastic pollution. This accumulating plastic waste poses increasingly major threats to marine mammals, as well as seabirds, turtles, fish, and crustaceans. These animals are at risk of getting entangled in the floating plastic debris being dumped into the ocean, which can cause death or severe injury. Ingesting even small amounts of the plastic materials may block their digestive systems, damage their stomachs, or lessen their feeding drives.
USER RESEARCH
How are people currently thinking about plastic waste in their every day life?
To understand how aware people are of their every day use of plastic and the negative effects of its use, we conducted two semi-structured interviews with people who fit into our target user group. We chose to target users who expressed an interest in using less plastic or had the desire to learn more about how their current habits are contributing to the plastic waste in our oceans. Through these interviews we learned that people are usually unaware of how much plastic they use despite the fact that many of the products they use on a daily basis are either made of plastic or packaged in plastic itself.
We identified the following problems:
People are unaware of where their plastic ends up after disposing of it.
The current level of plastic pollution in our oceans is not widely known.
The detrimental effects of plastic pollution to marine life is not obvious.
From our research we learned that people are currently lacking the awareness needed to understand the severity of the plastic pollution problem as well as the detrimental effects of their own plastic usage habits.
INFORMATION ARCHITECTURE
After understanding how people are currently thinking about plastic waste and how knowledgeable they are about plastic in general, we identified the key features that we wanted Plastic Oceans to include. By constructing the information architecture of our application, we were able to analyze the navigation between components and visualize the actual flow of interactions throughout the entire app as well.
Along with developing our application's architecture, we were also able to identify the three use cases of Plastic Oceans:
Discovery: Users can discover along coastlines in the US to see how much plastic is incorrectly disposed of.
Footprint: Users can see their own plastic footprint and see what they can do, via accepting pledges, what they can do to reduce their own footprint.
Quizzes: Users can take quizzes to test their knowledge about current plastic statistics and the efforts to reduce plastic waste.
PAPER PROTOTYPE
With the knowledge gained from our initial user interviews, we began designing our app with the problems we intended to mitigate kept in mind. Since we intended to create a web application that could be used on both mobile phones and computers of any size and resolution, we began designing with a mobile-first approach. All of our designs were initially made for mobile phones and then made responsive for bigger screen sizes. This ensures compatibility across multiple devices as it’s easier to scale content bigger than it is to scale it smaller to fit smaller devices. All important information will be displayed in the mobile view to begin with so additional information will only be added in the desktop view if there’s extra space not being used. This eliminates the risk of having to decide what information to discard at a later time during the development phase.
NAVIGATION
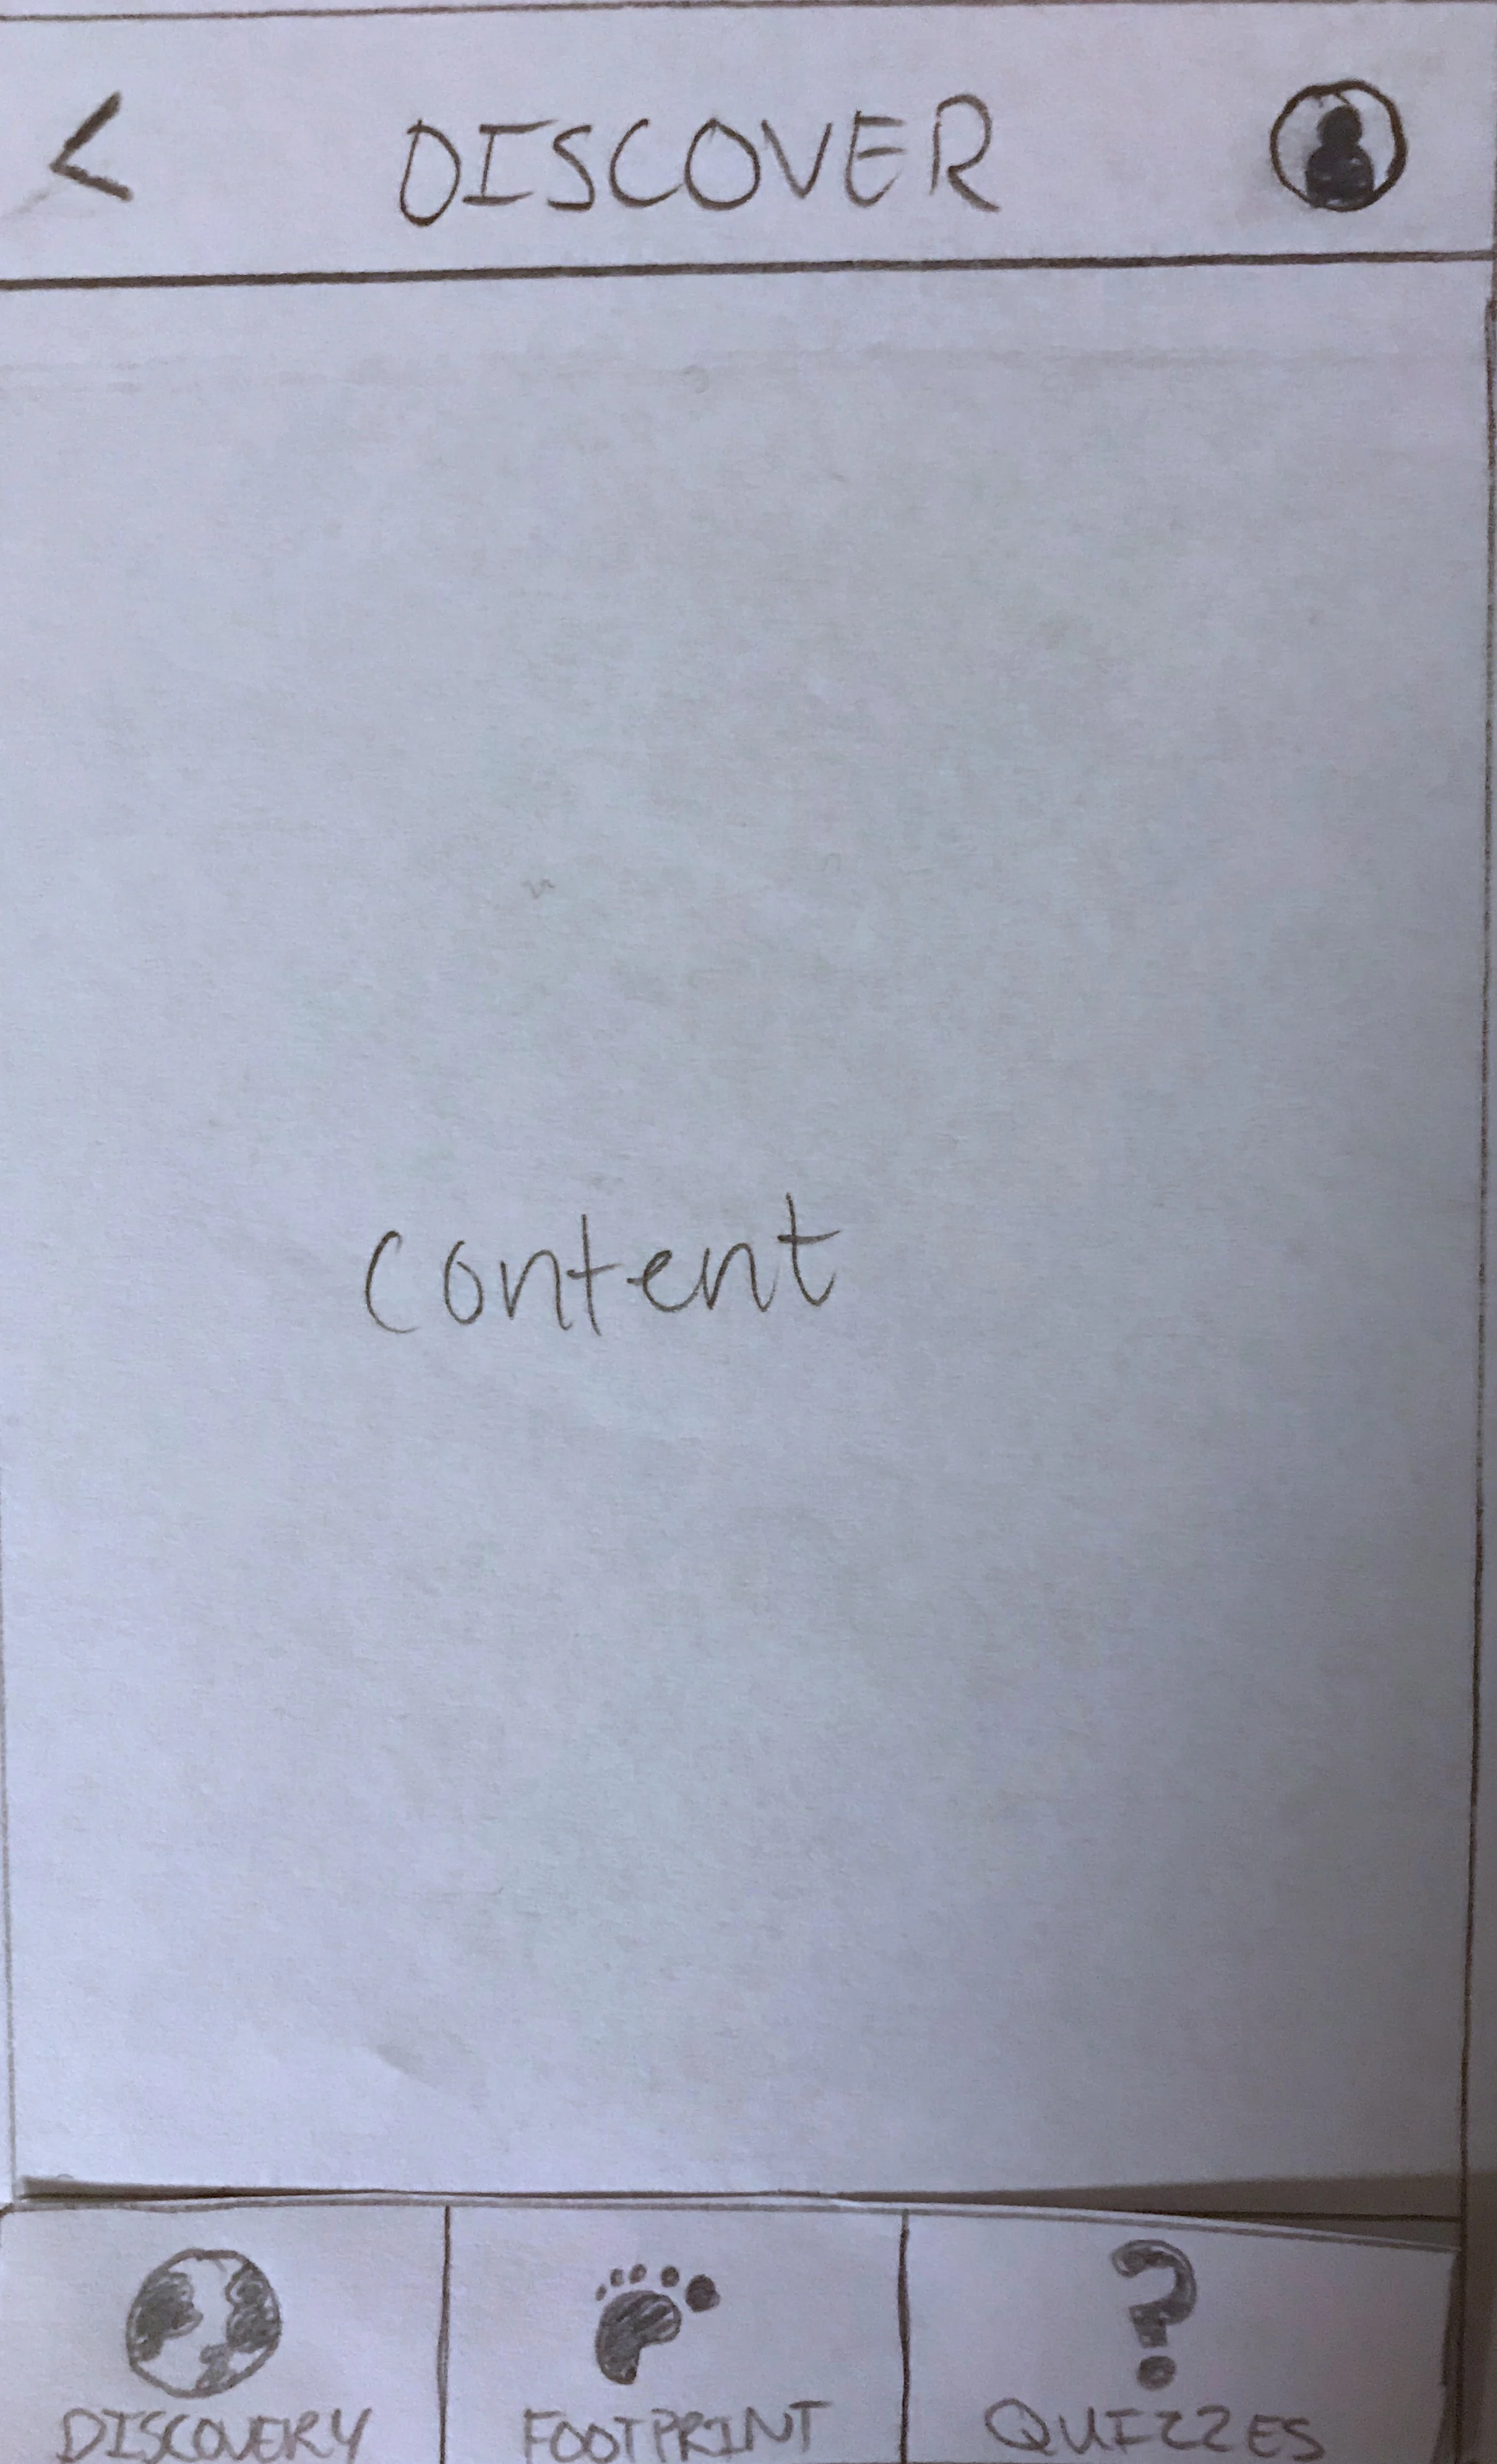
For mobile screens, the top navigation bar only includes a back navigation button and an avatar that navigates to the user's profile. Along the bottom of the screen is where we put the main navigation (discover, footprint, and quizzes) as this area is the most convenient area for users to access while using their hand to navigate to different screens on mobile phones.
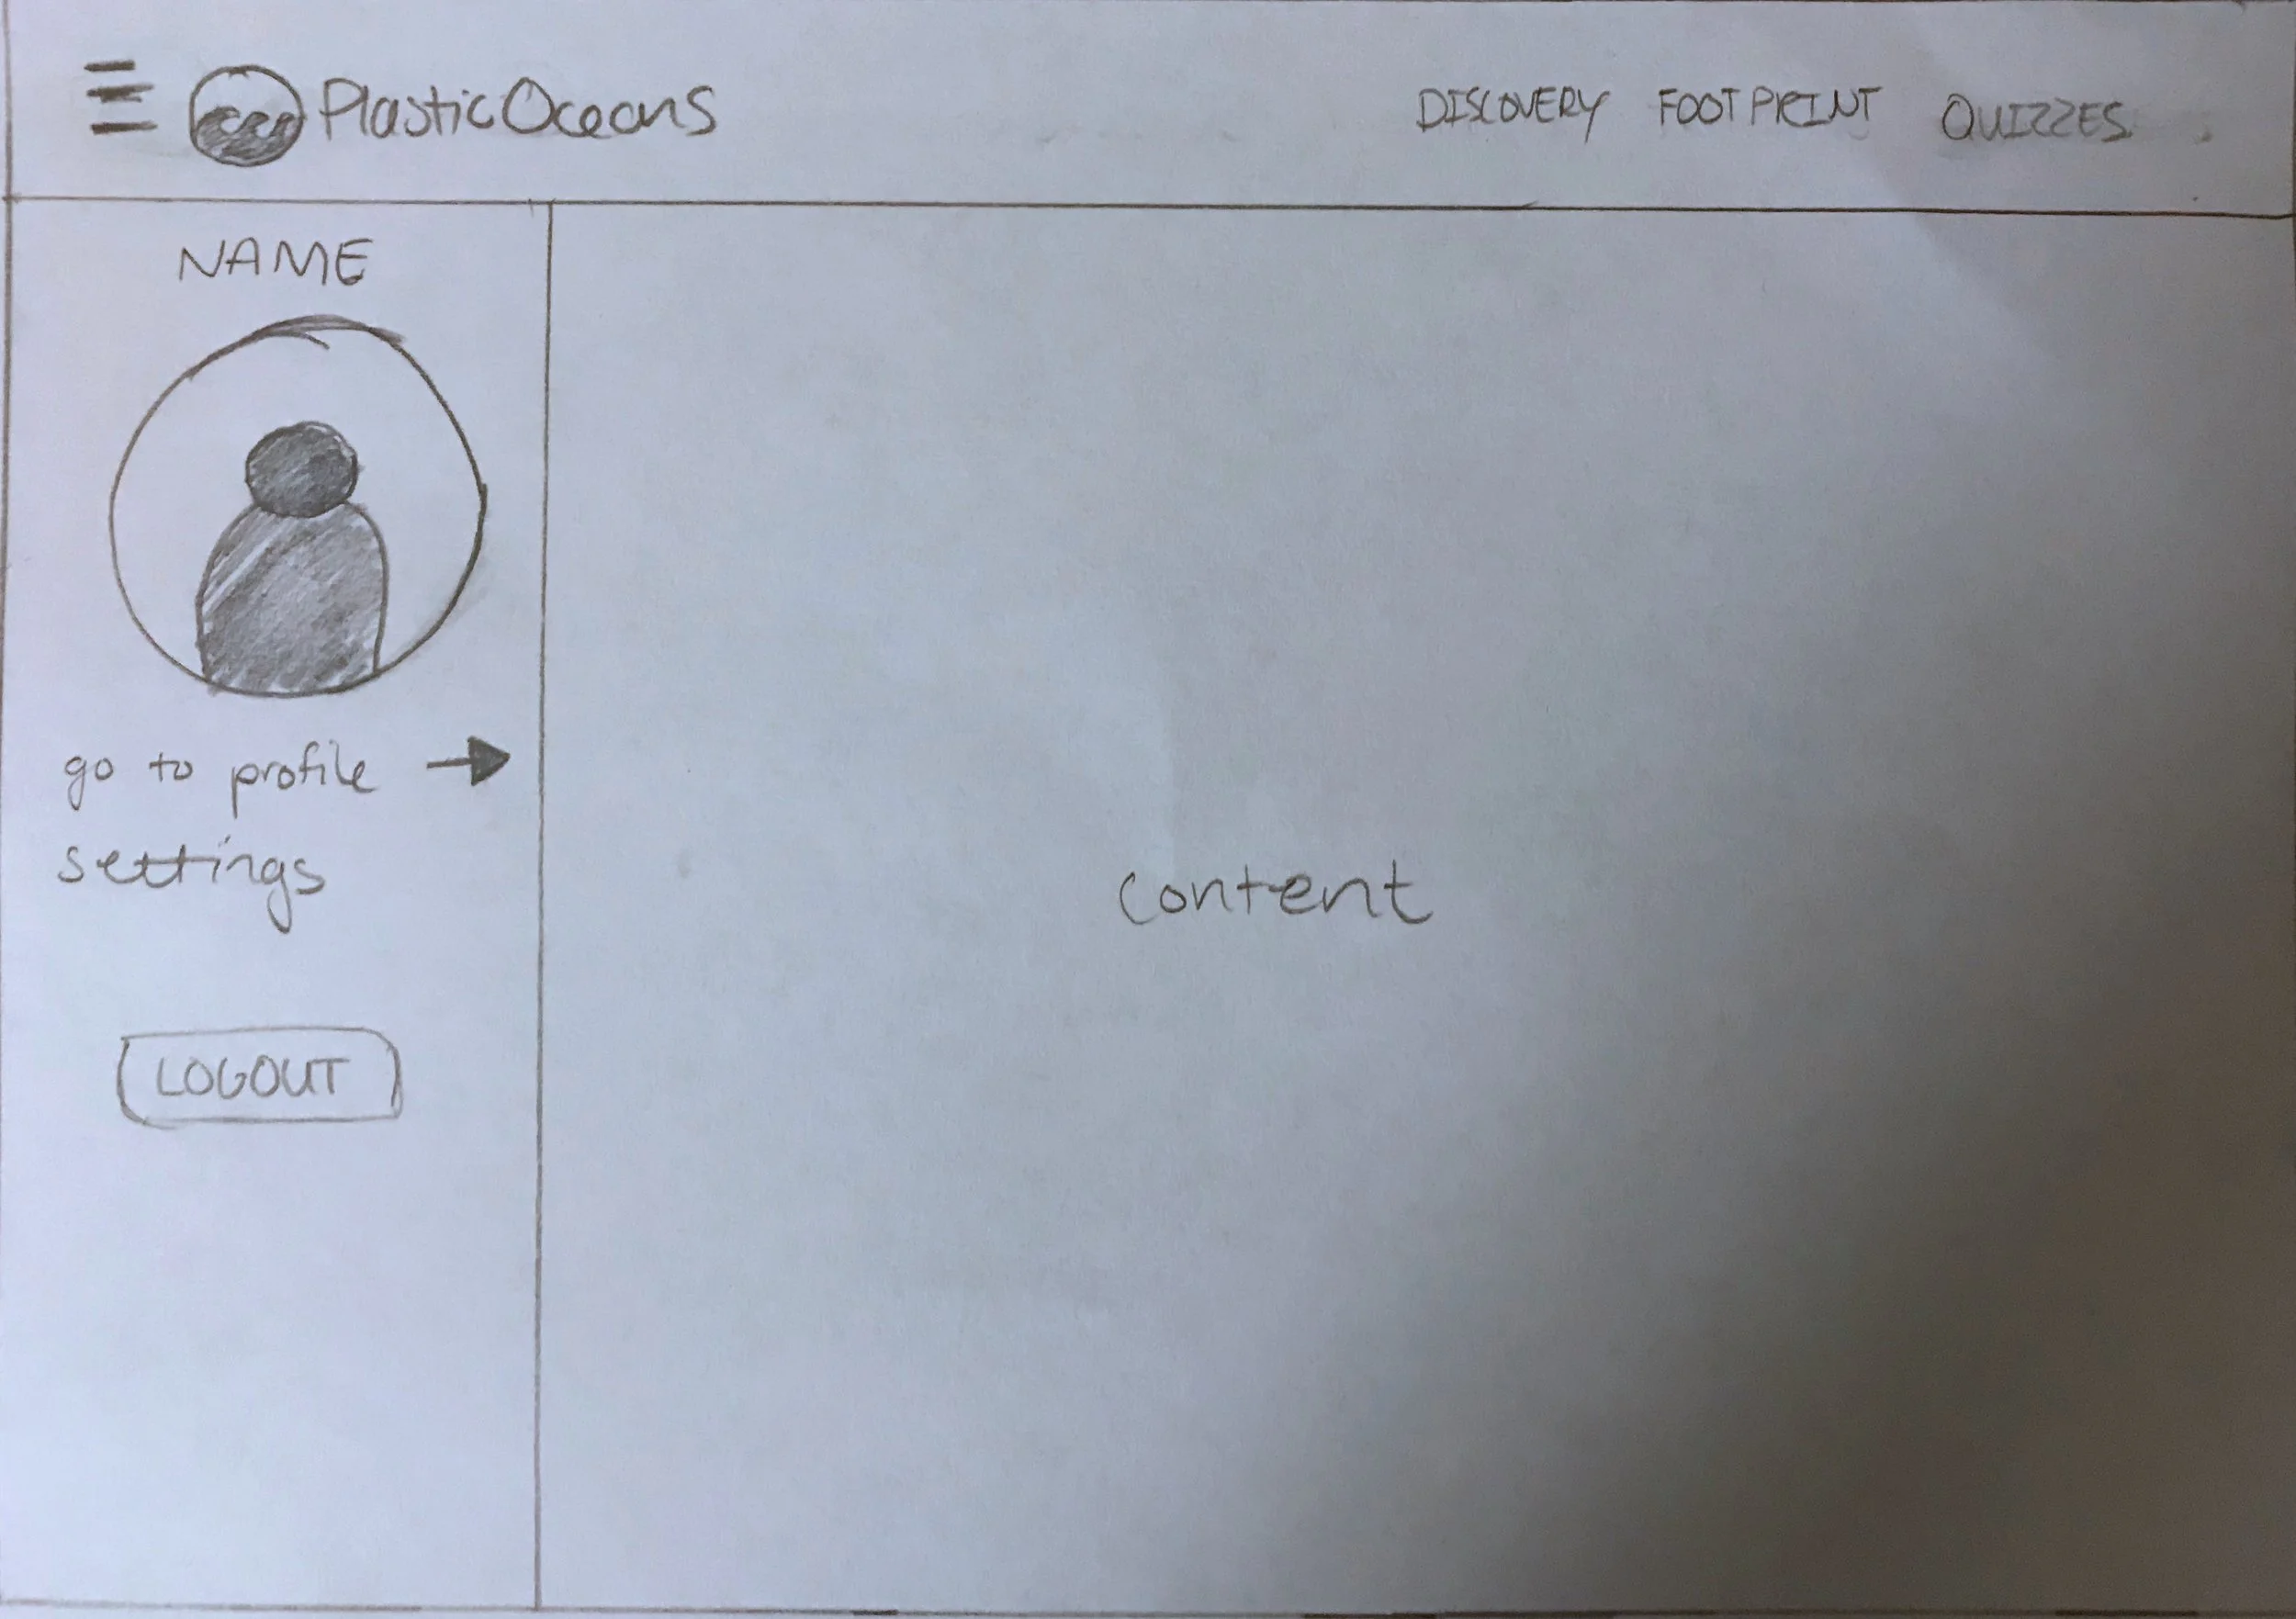
On the web version, the top navigation bar includes a side navigation drawer on the left side along with the three primary links (discover, footprint, and quizzes) on the right side. The side navigation drawer is where we intend to put links to areas of the website that are less commonly accessed, such as profile and settings, so that they are out of the user’s way and allows the content area to be maximized.
DISCOVER
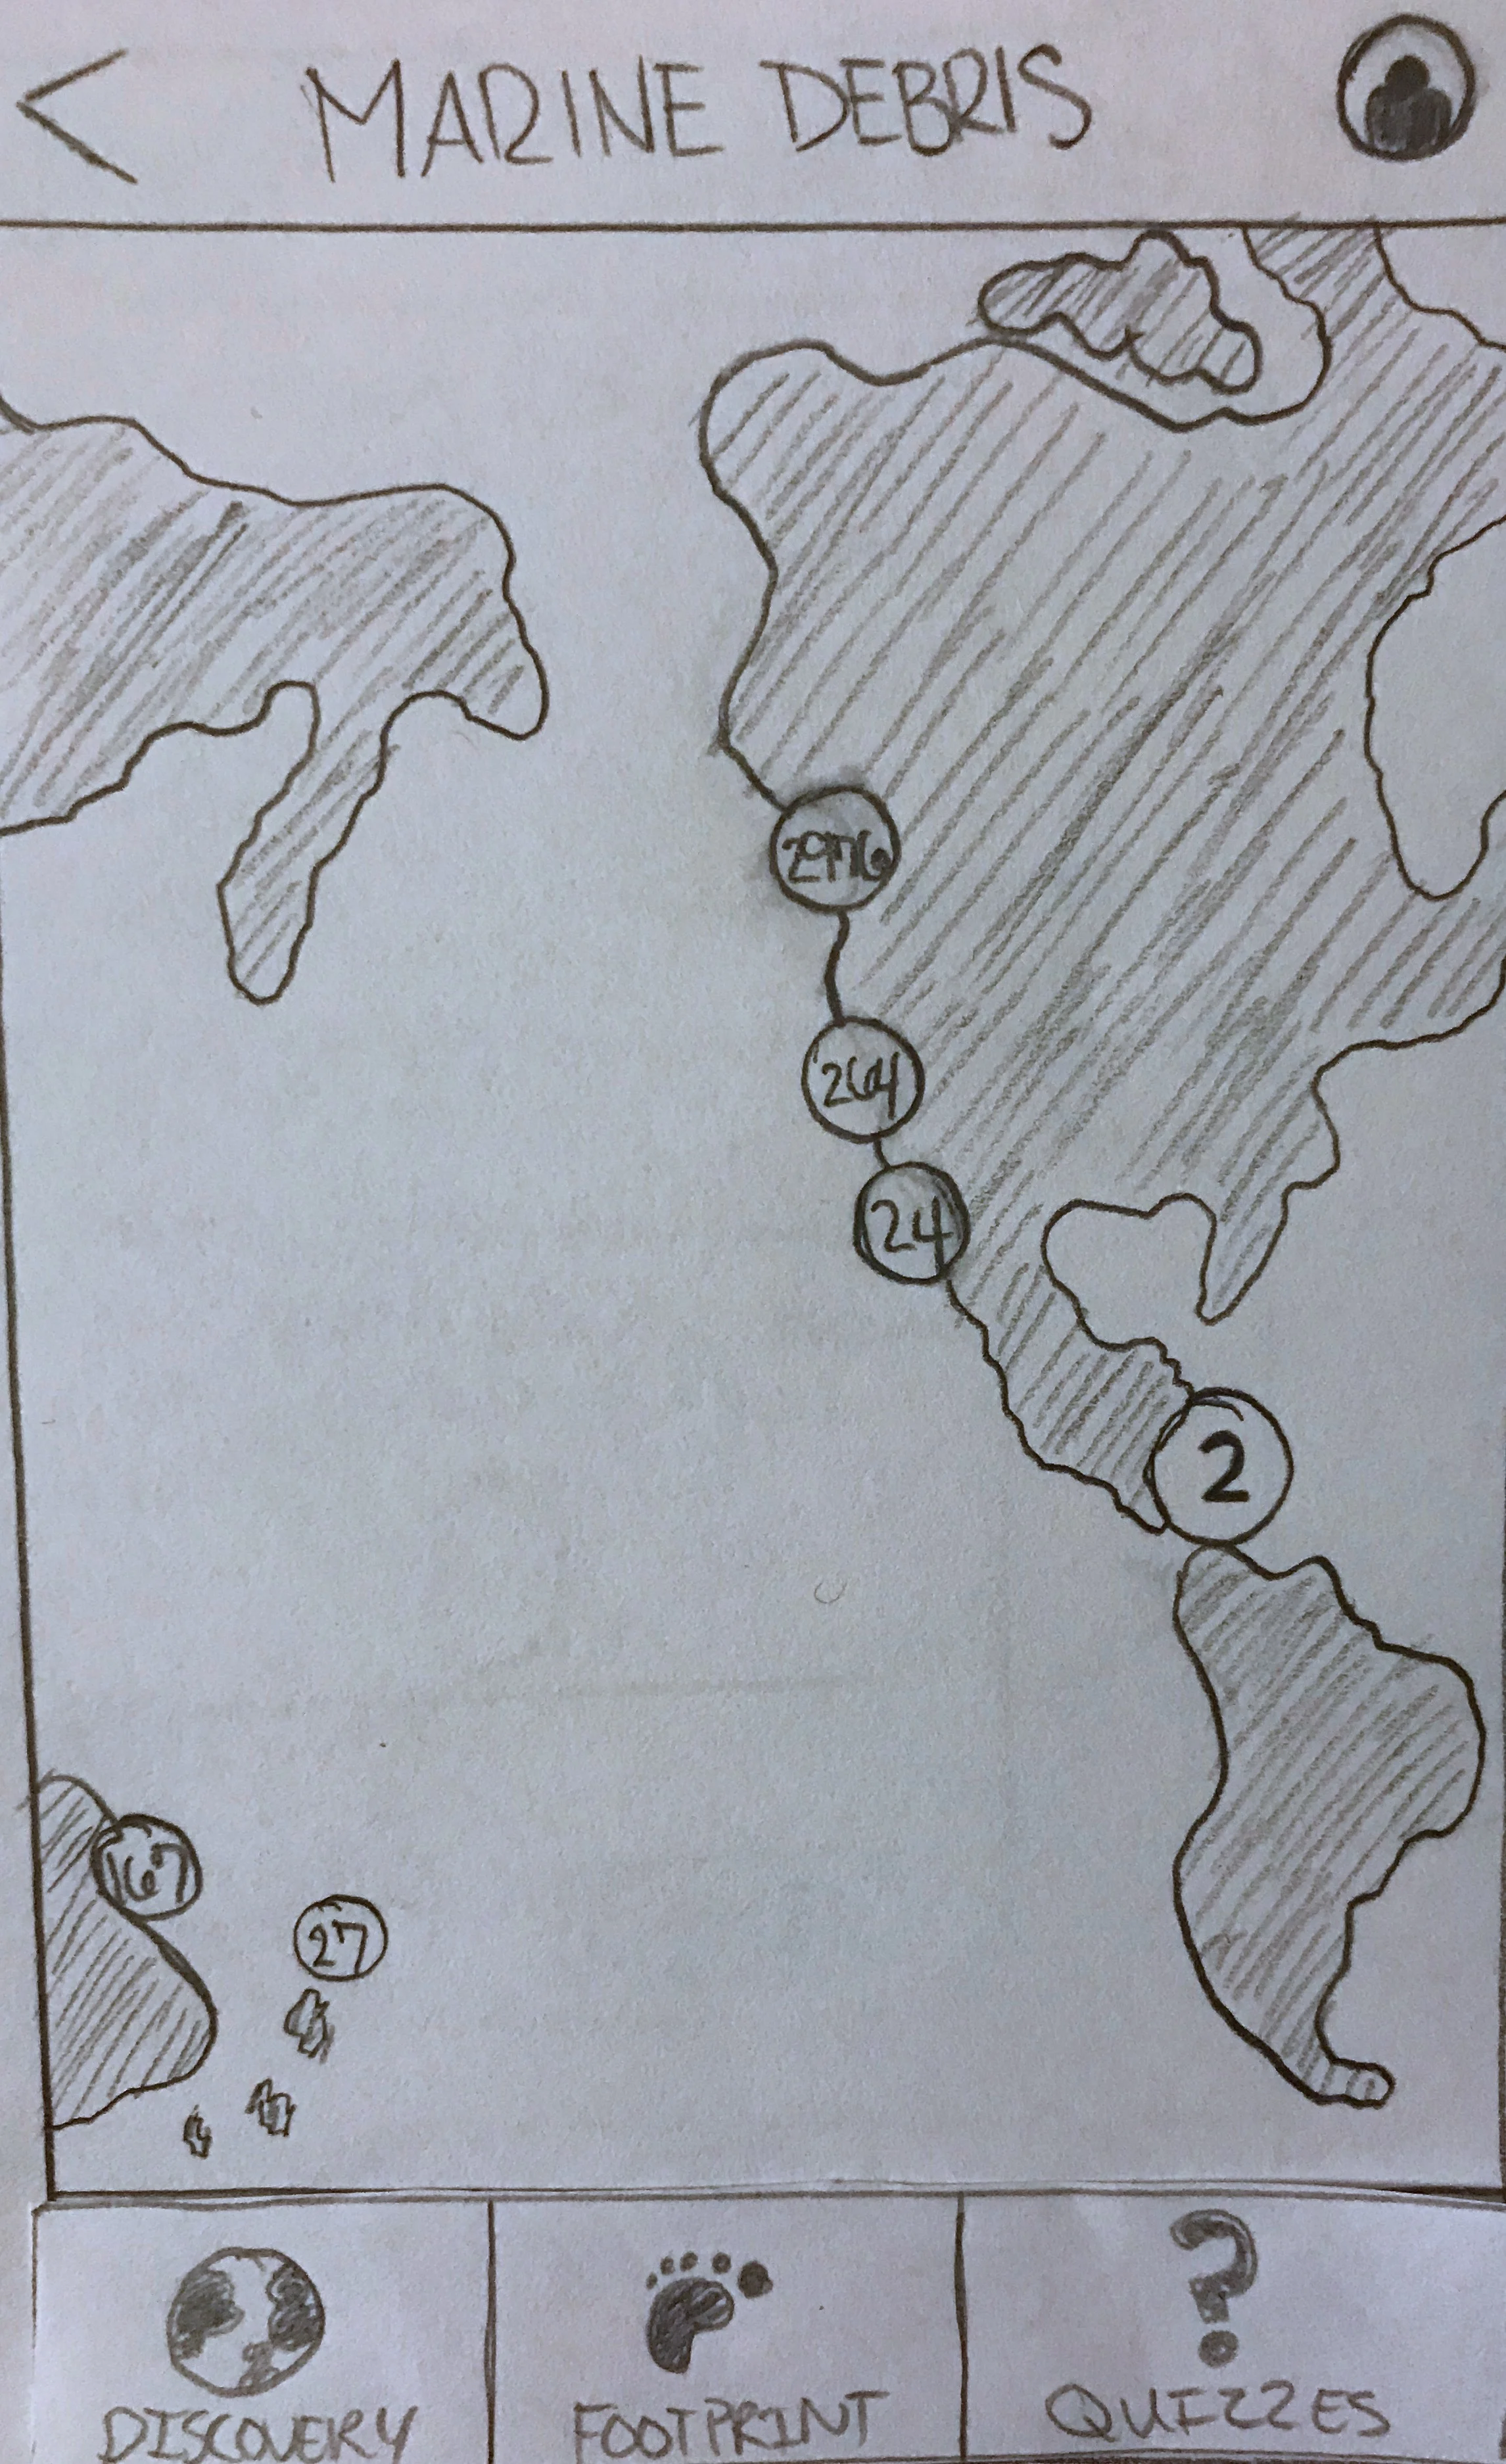
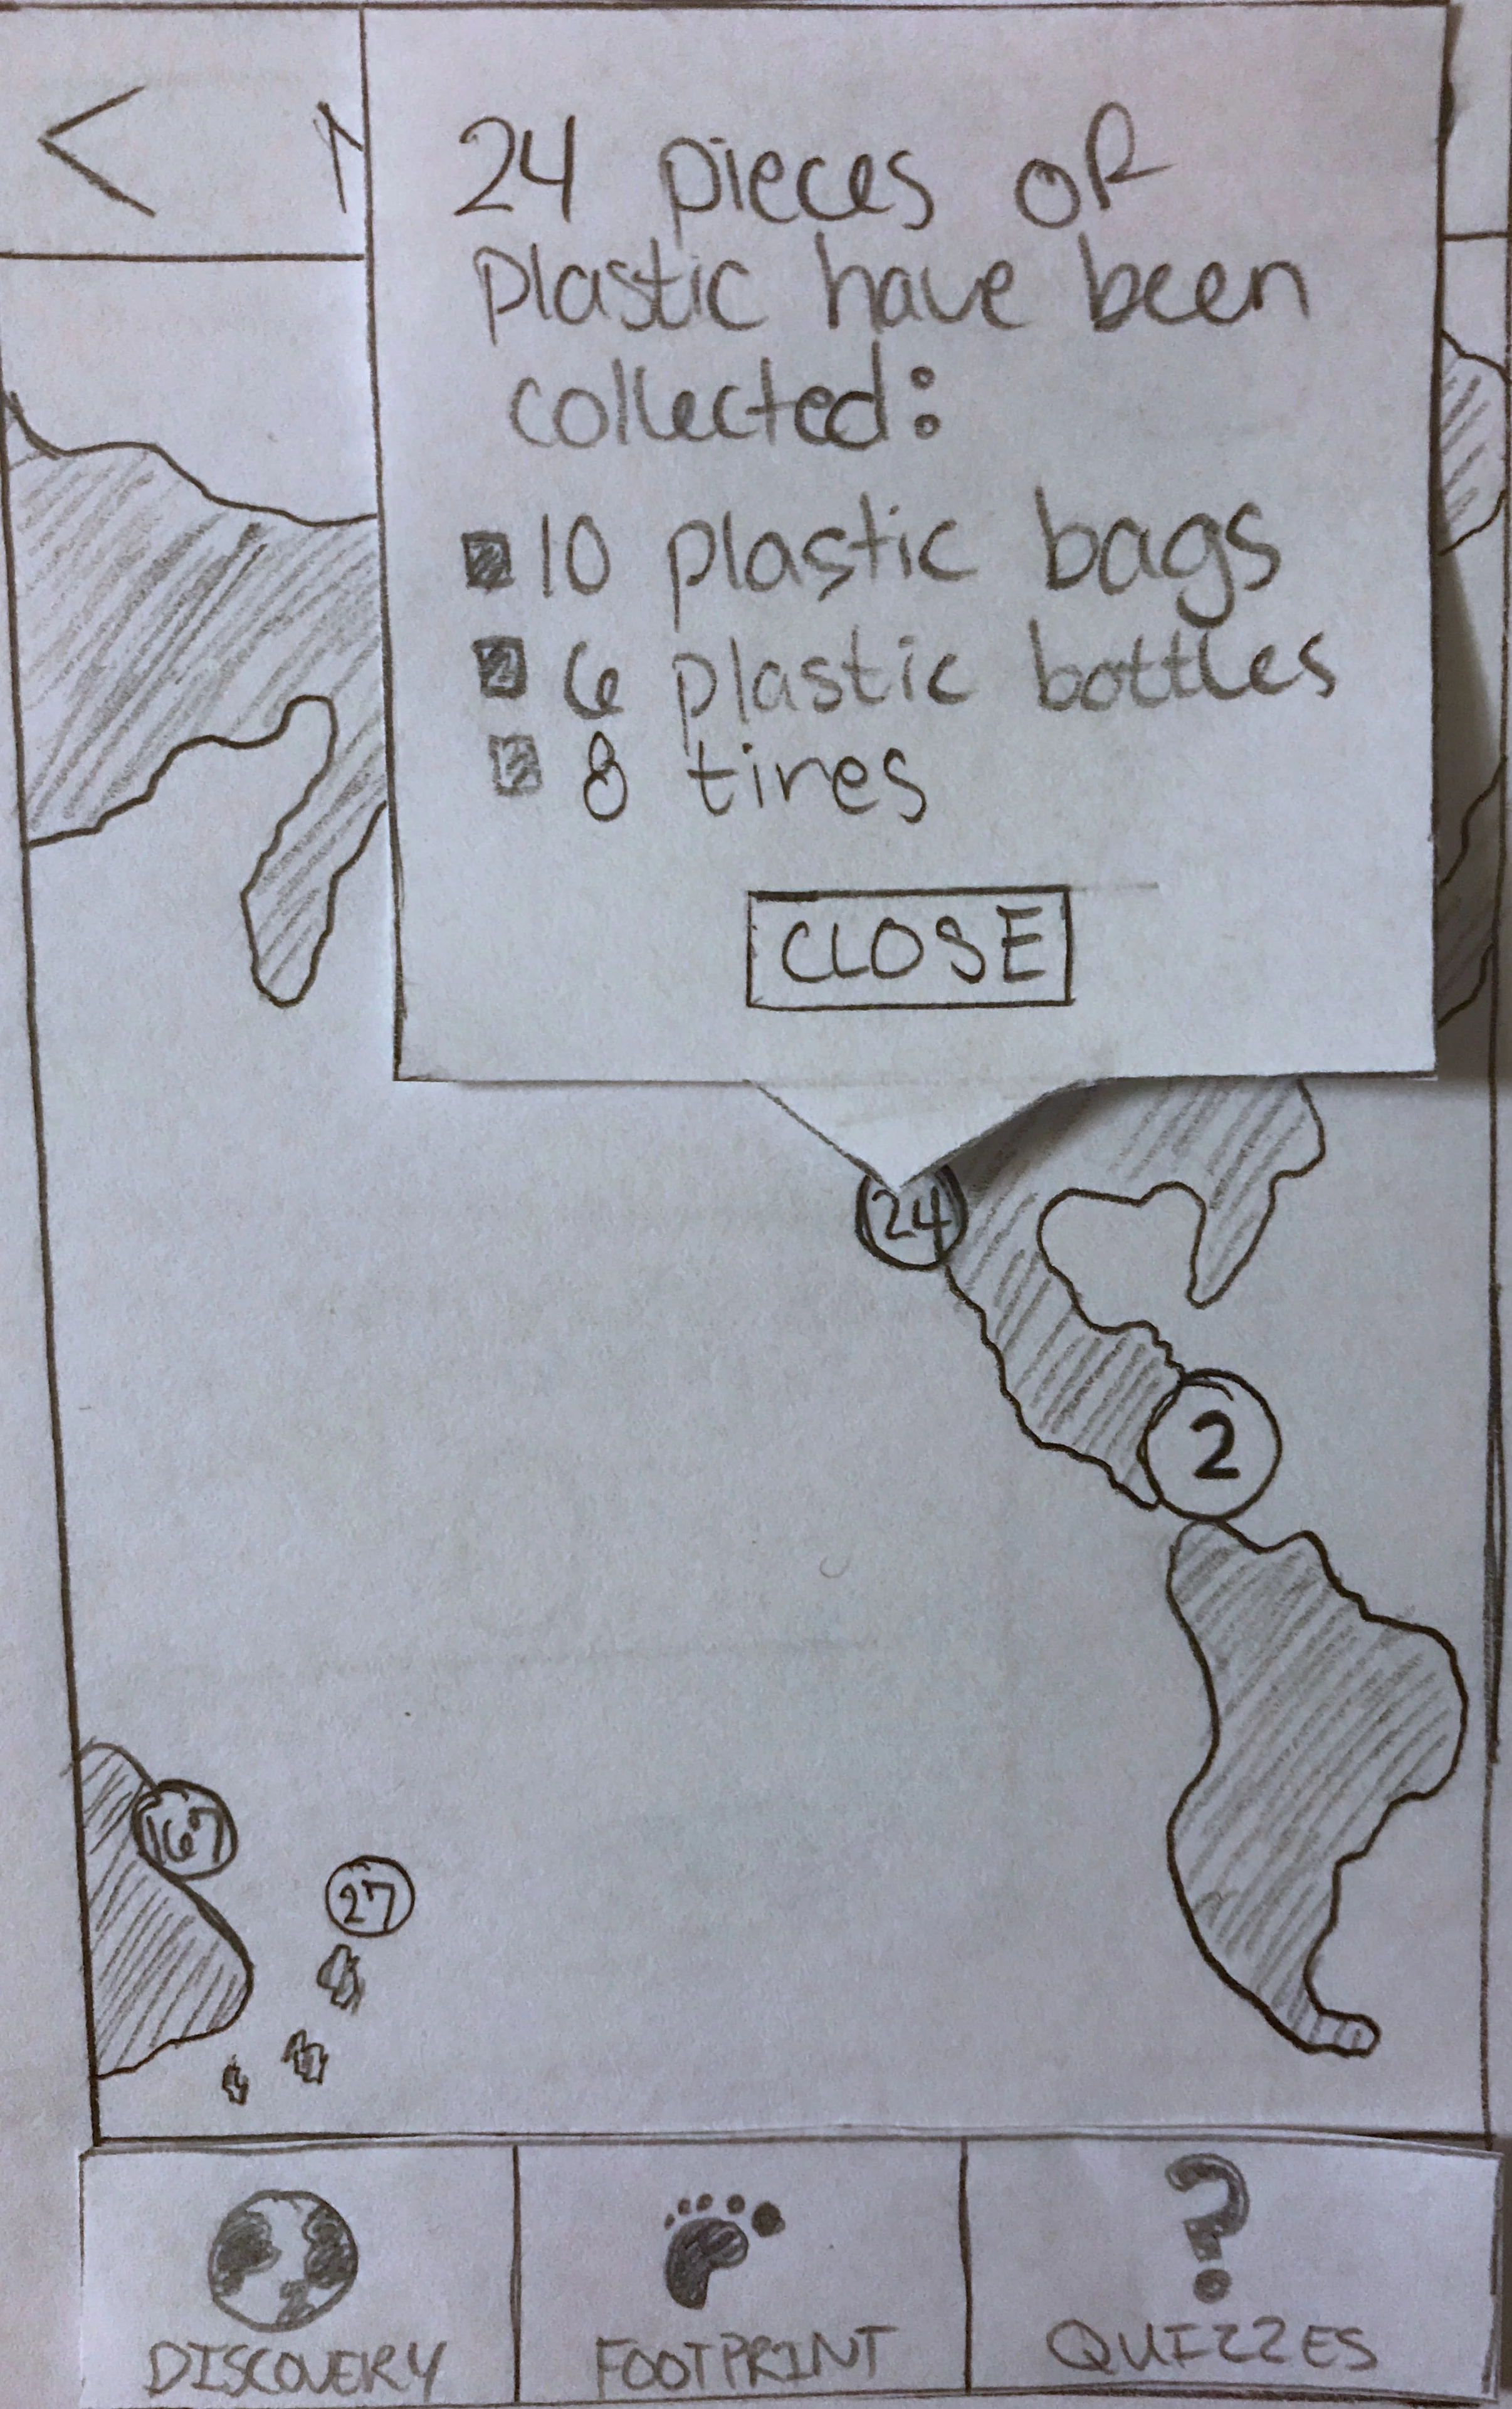
When a user first logs into Plastic Oceans, they are taken to the discover screen where they can view the entire world map and the amount of trash that has been collected along the coastlines. Each circle is labeled with the total amount of trash that has been collected and reported at this particular location. Tapping on any of these circles brings up a detailed popover that outlines the different kinds of trash usually collected there. Immediately introducing users to a subset of the total amount of trash found along coastlines helps to bring awareness to the both the importance of disposing of plastic correctly and the detrimental effects of even using it in the first place.
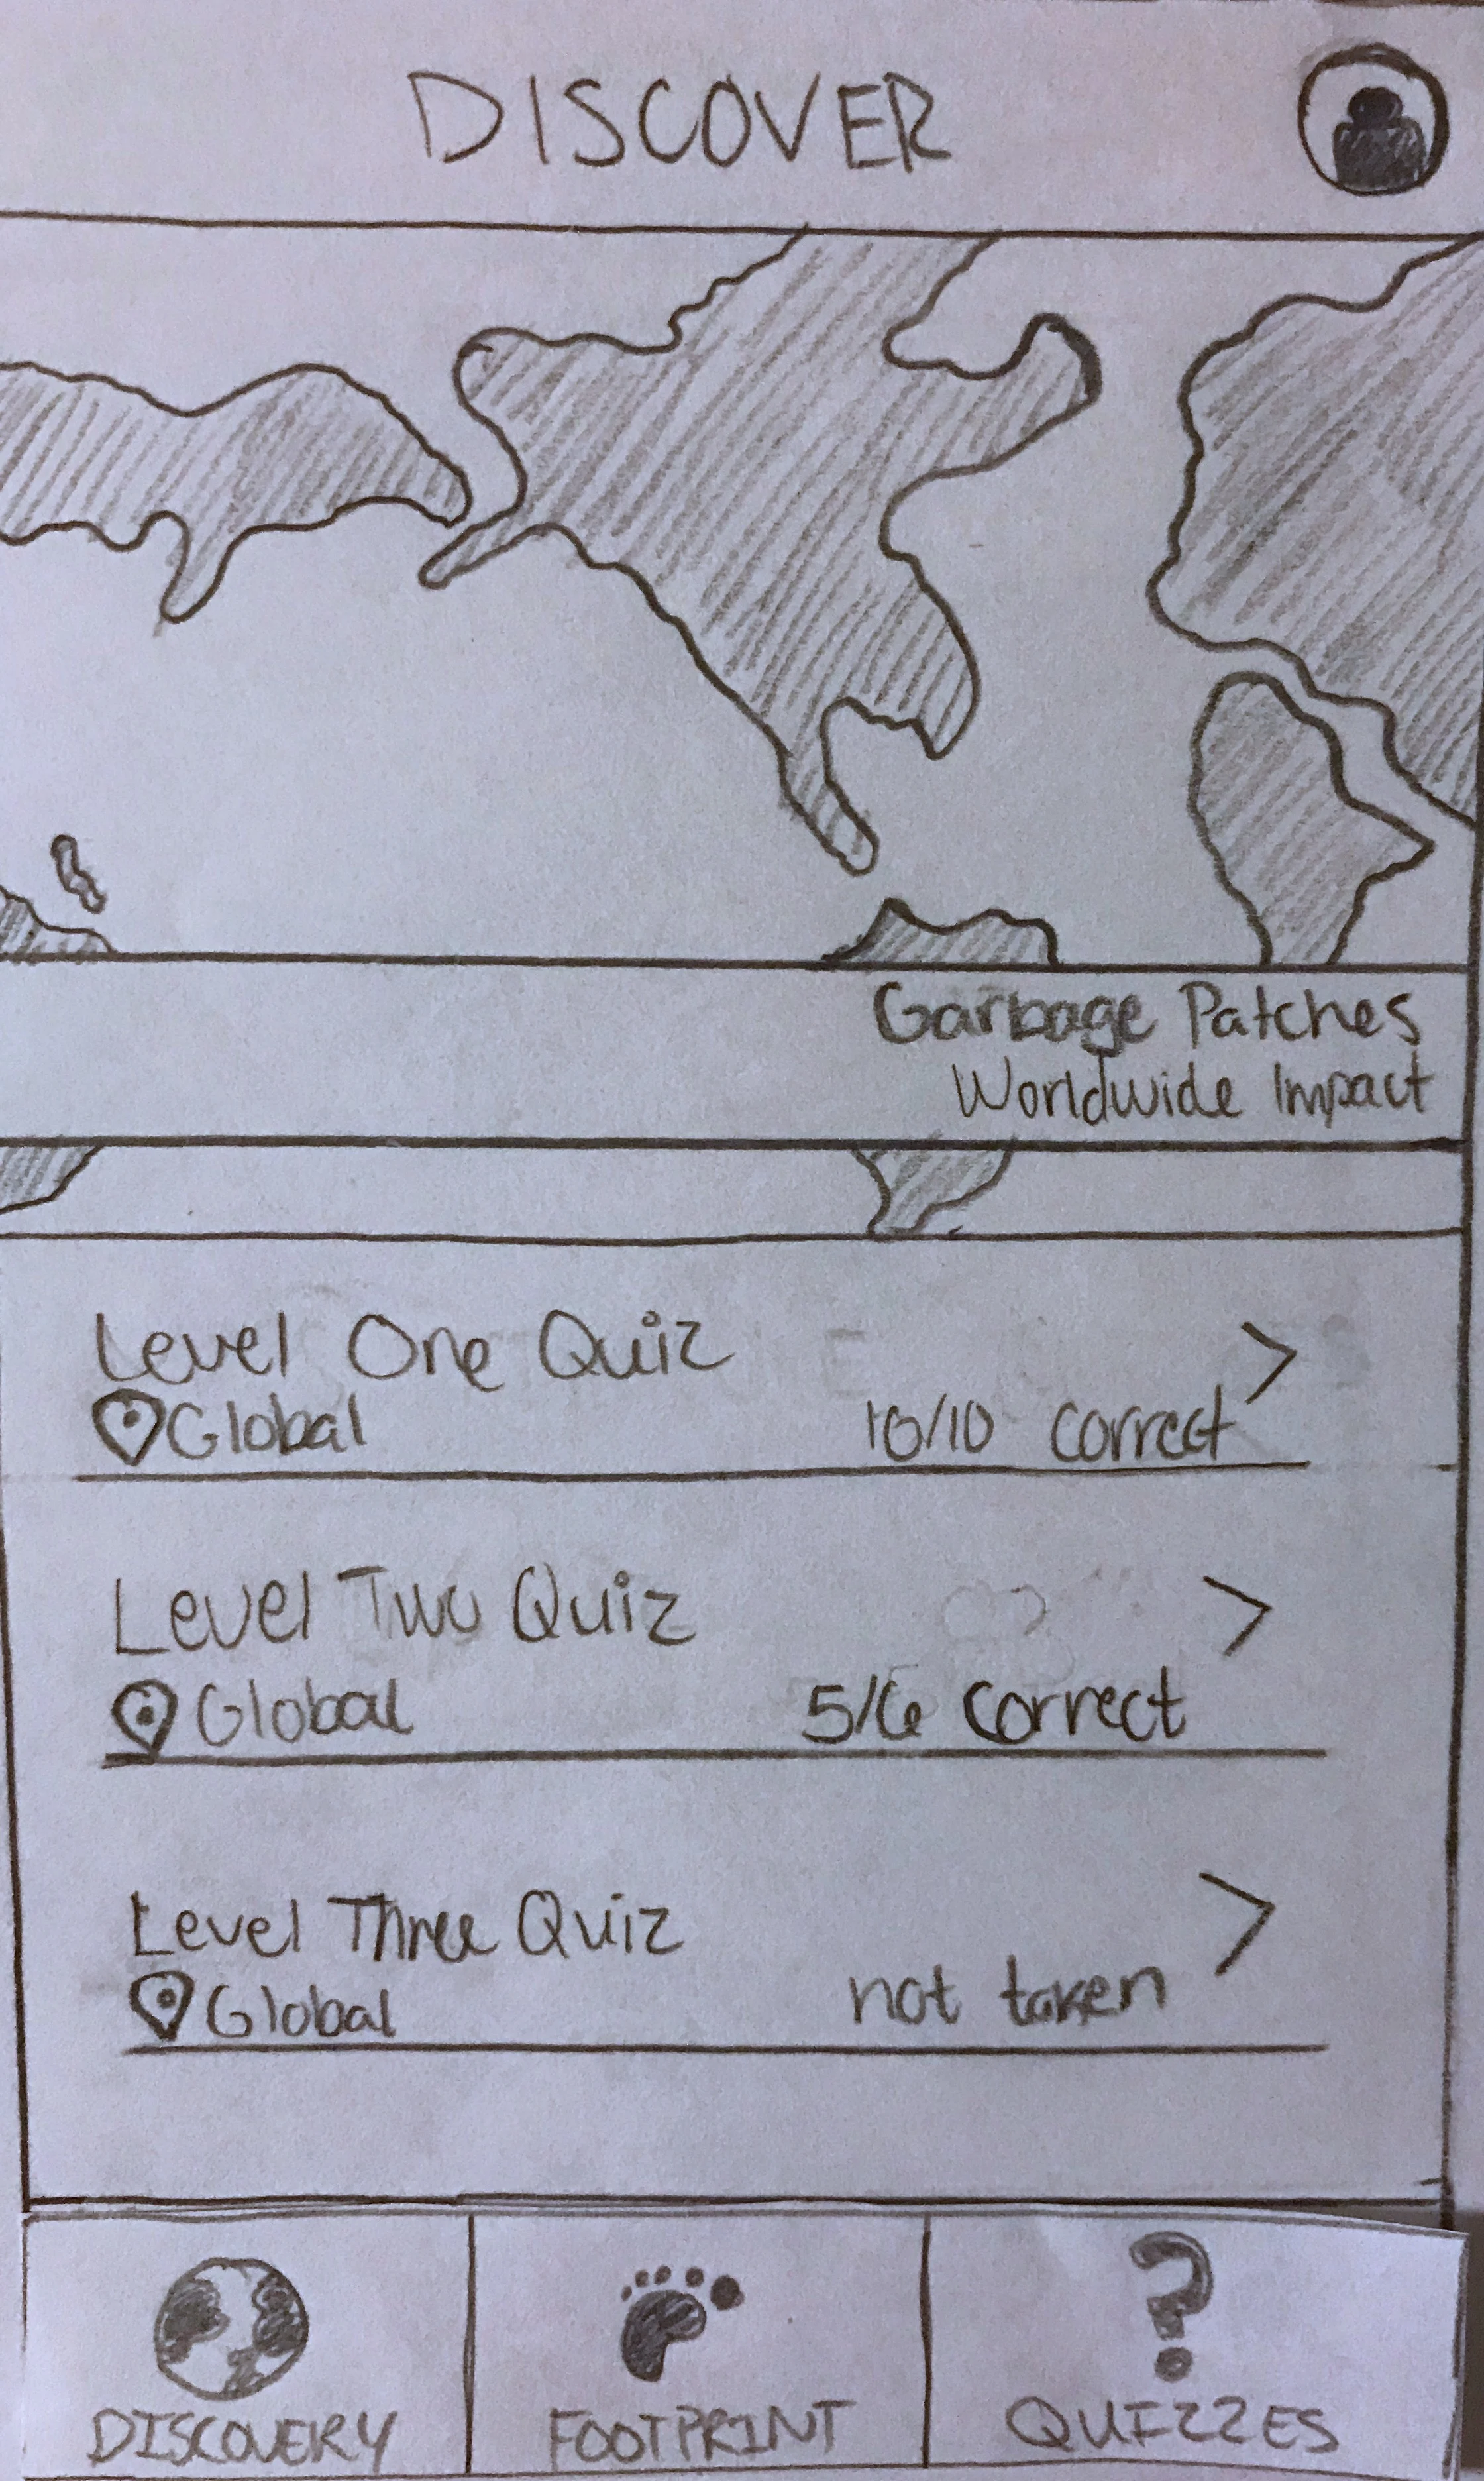
QUIZZES
Visiting the quizzes tab opens up a list of available quizzes that the user can take to test their knowledge about ocean plastics. Each quiz is labeled with either a global or local scope so that users know prior to taking the quiz what kinds of questions it contains. This informs users of the type of content they should expect to see prior to beginning the quiz so that they know if they're ready to test their knowledge in either area.
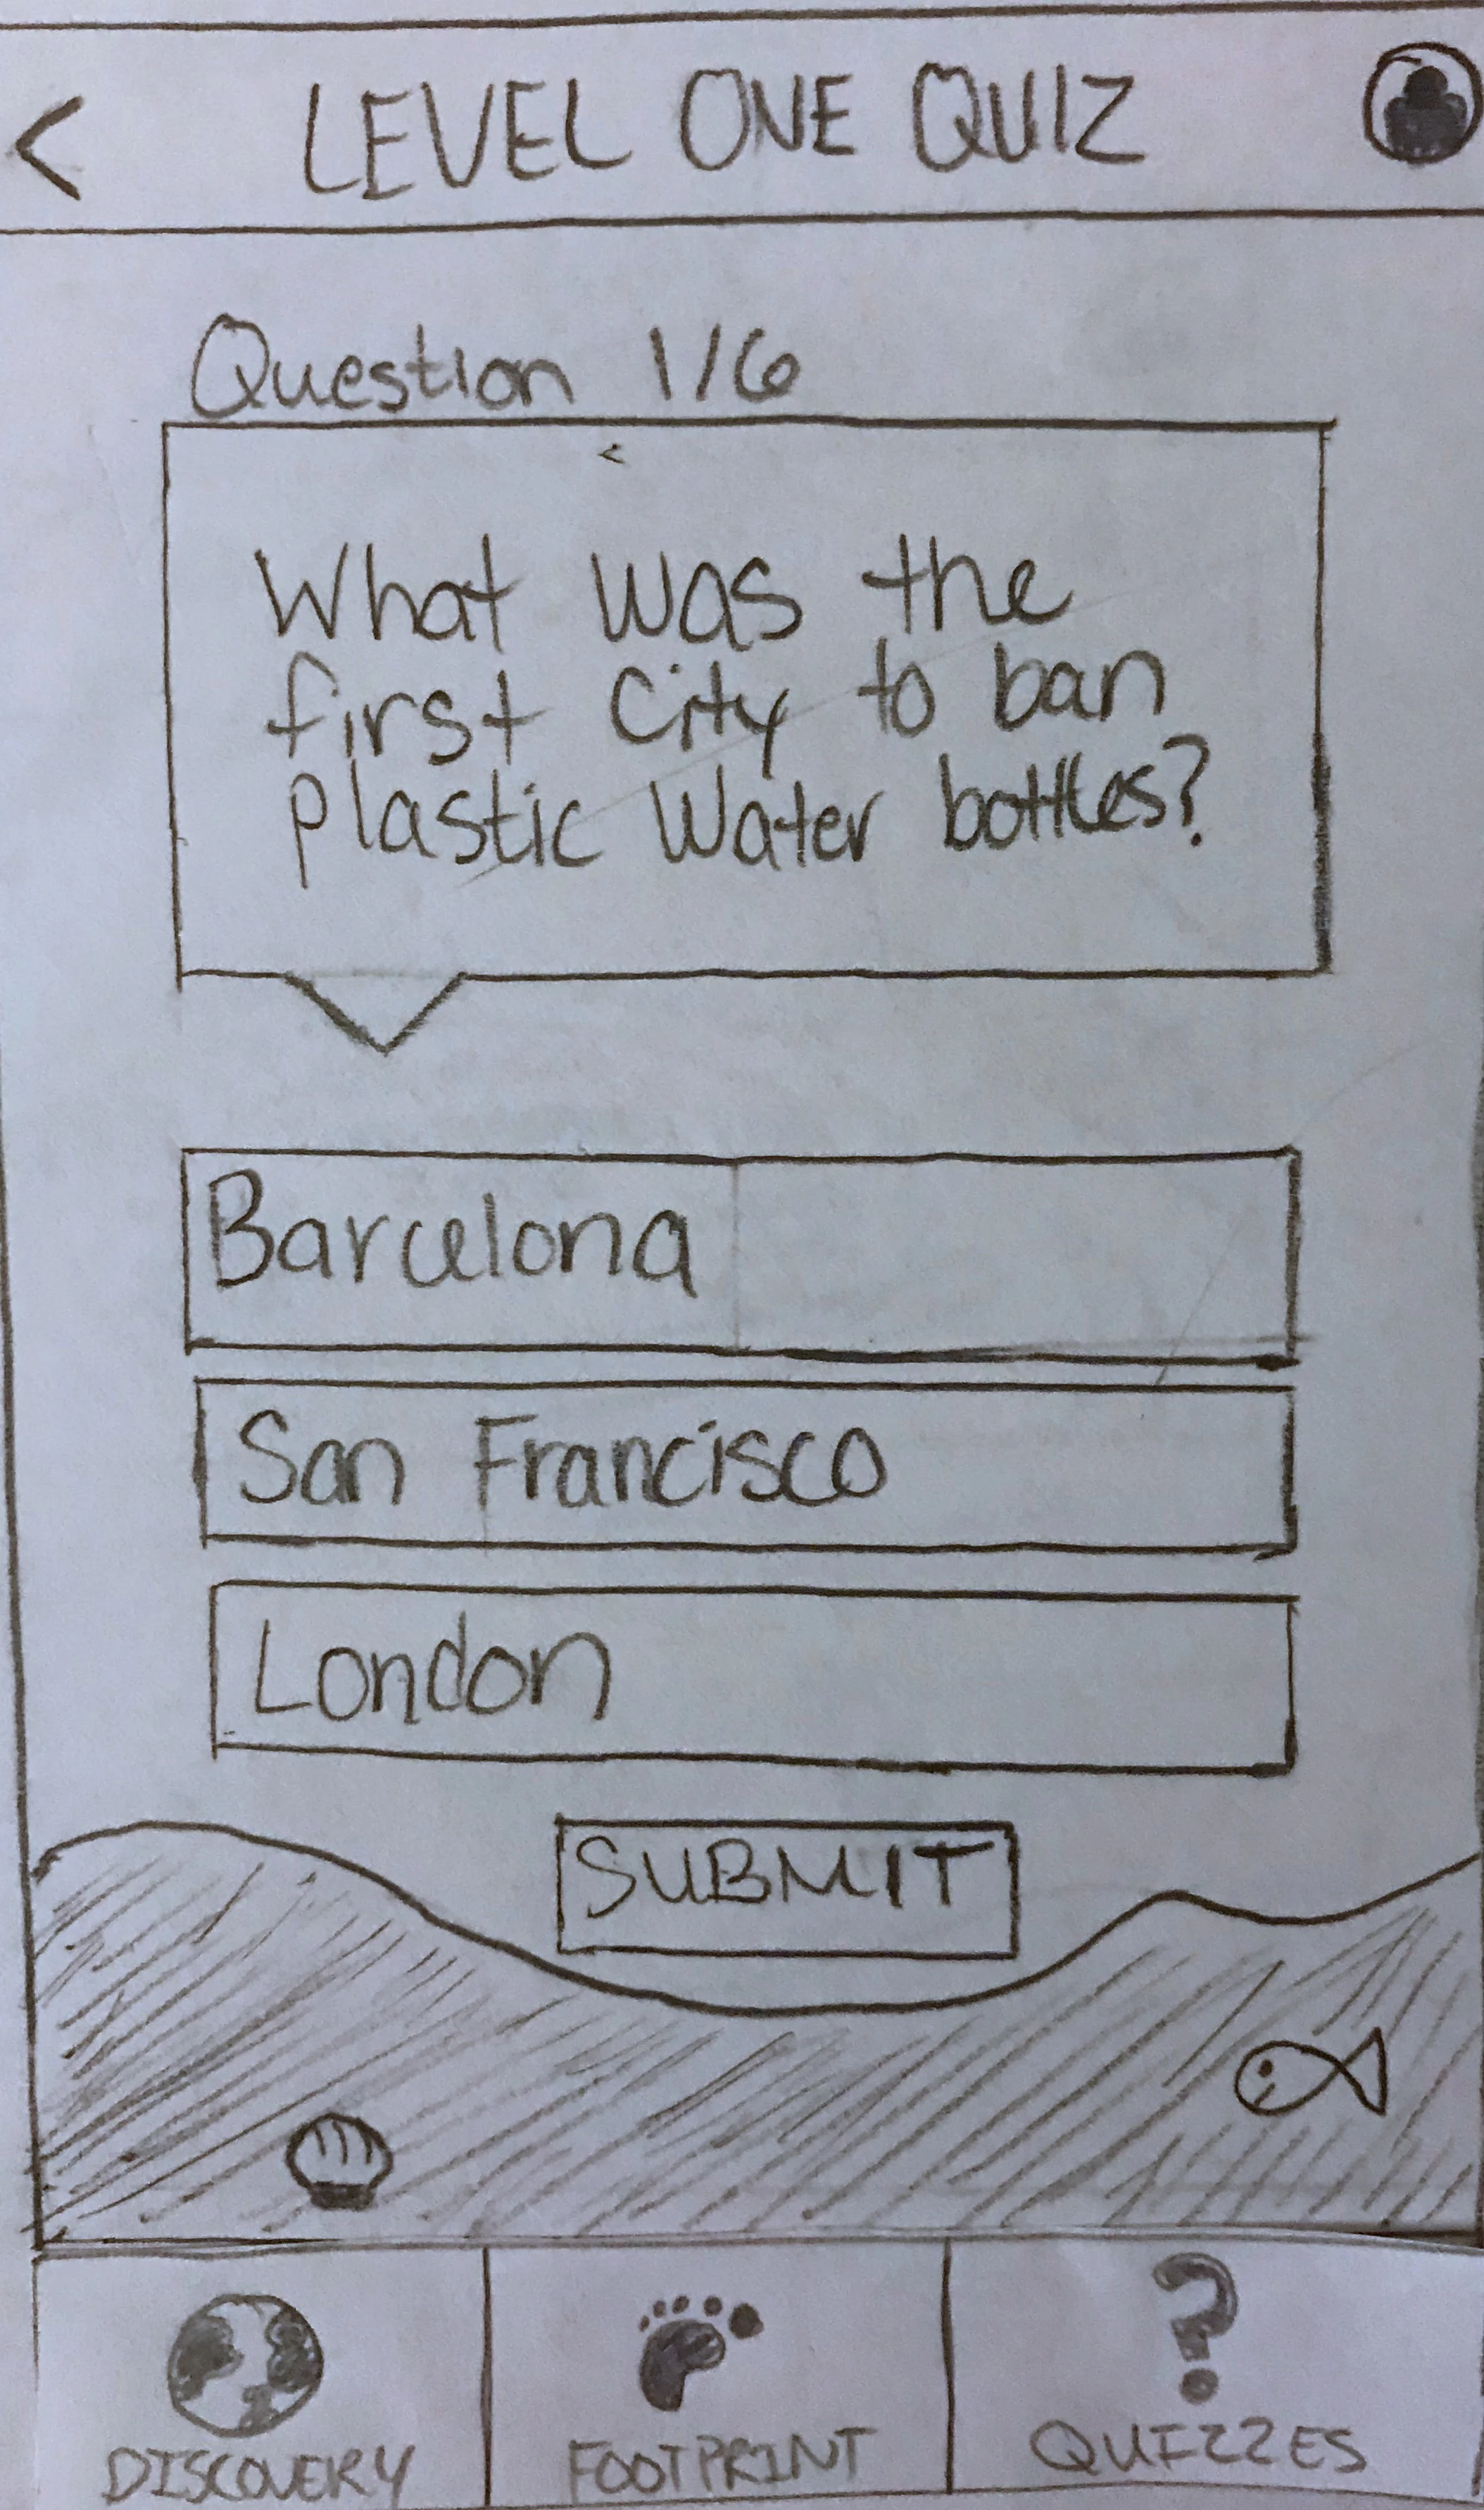
A multiple choice format was used for the questions because it helps give users hints about what the right answer may be if they don't remember or know for sure. Long/short answer questions could potentially make the quiz process harder and less likely to be fun, which was not our objective. We want our users to enjoy testing their knowledge and learning new things about the questions they may have been confused about initially.
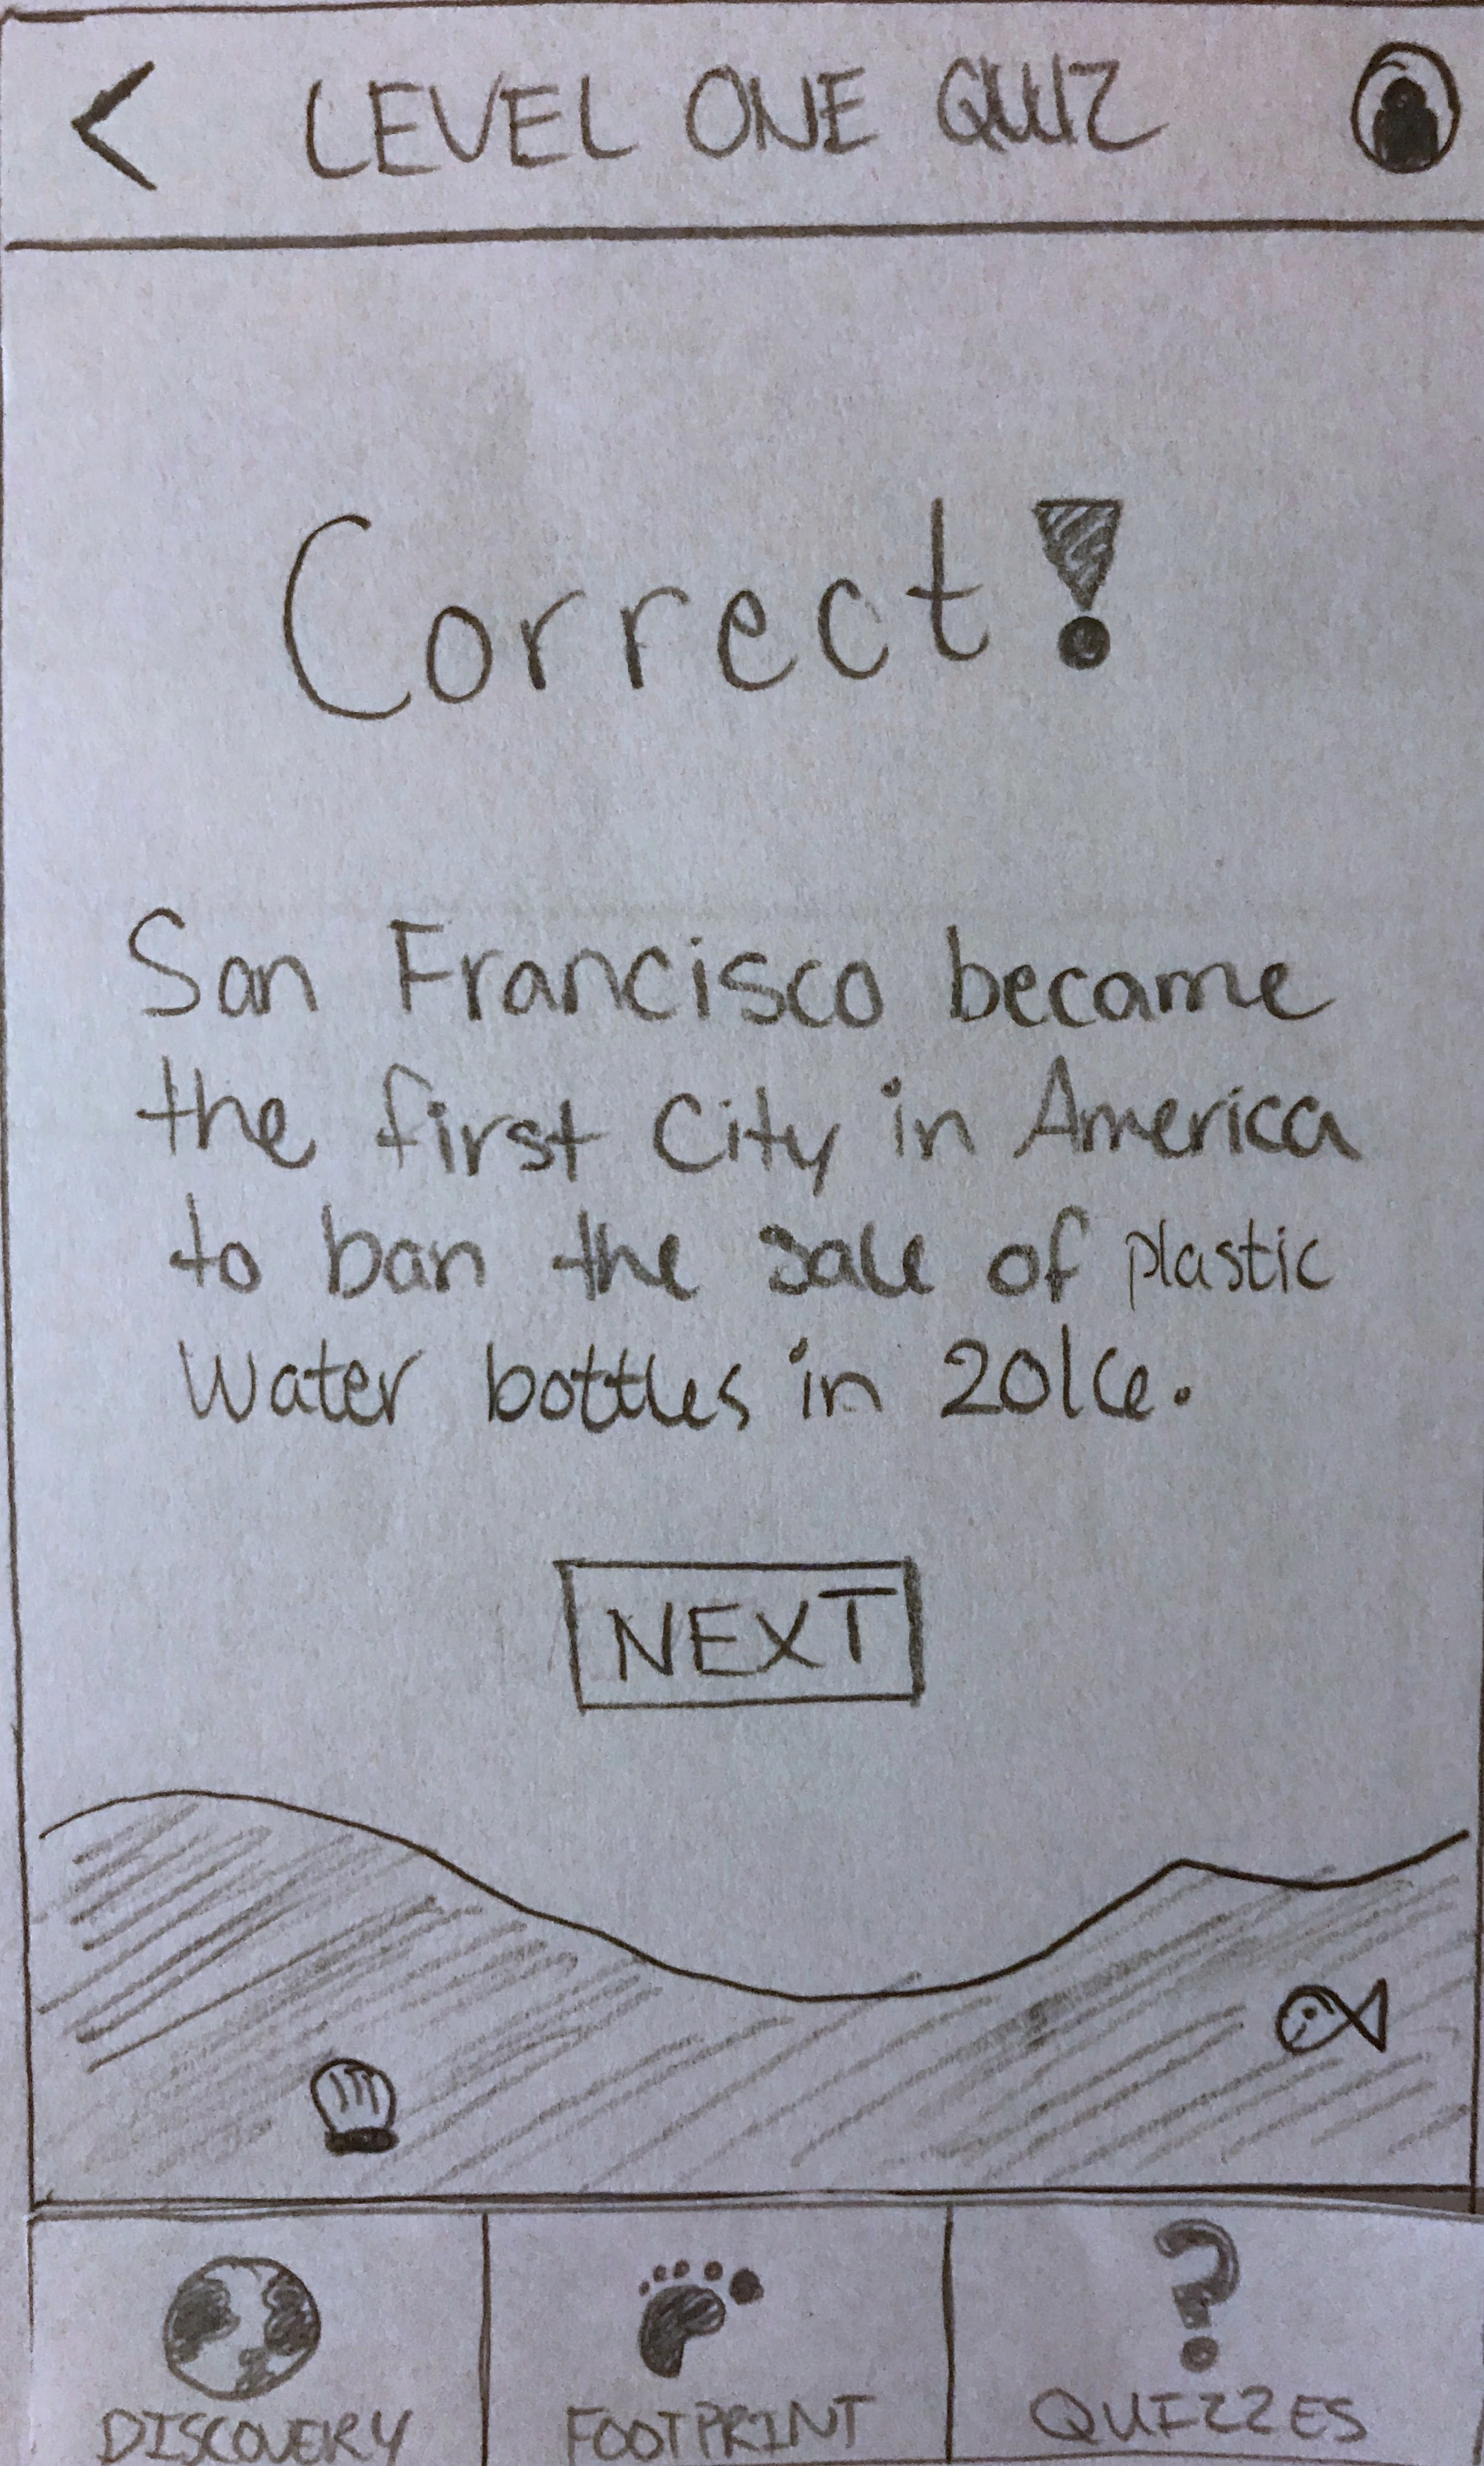
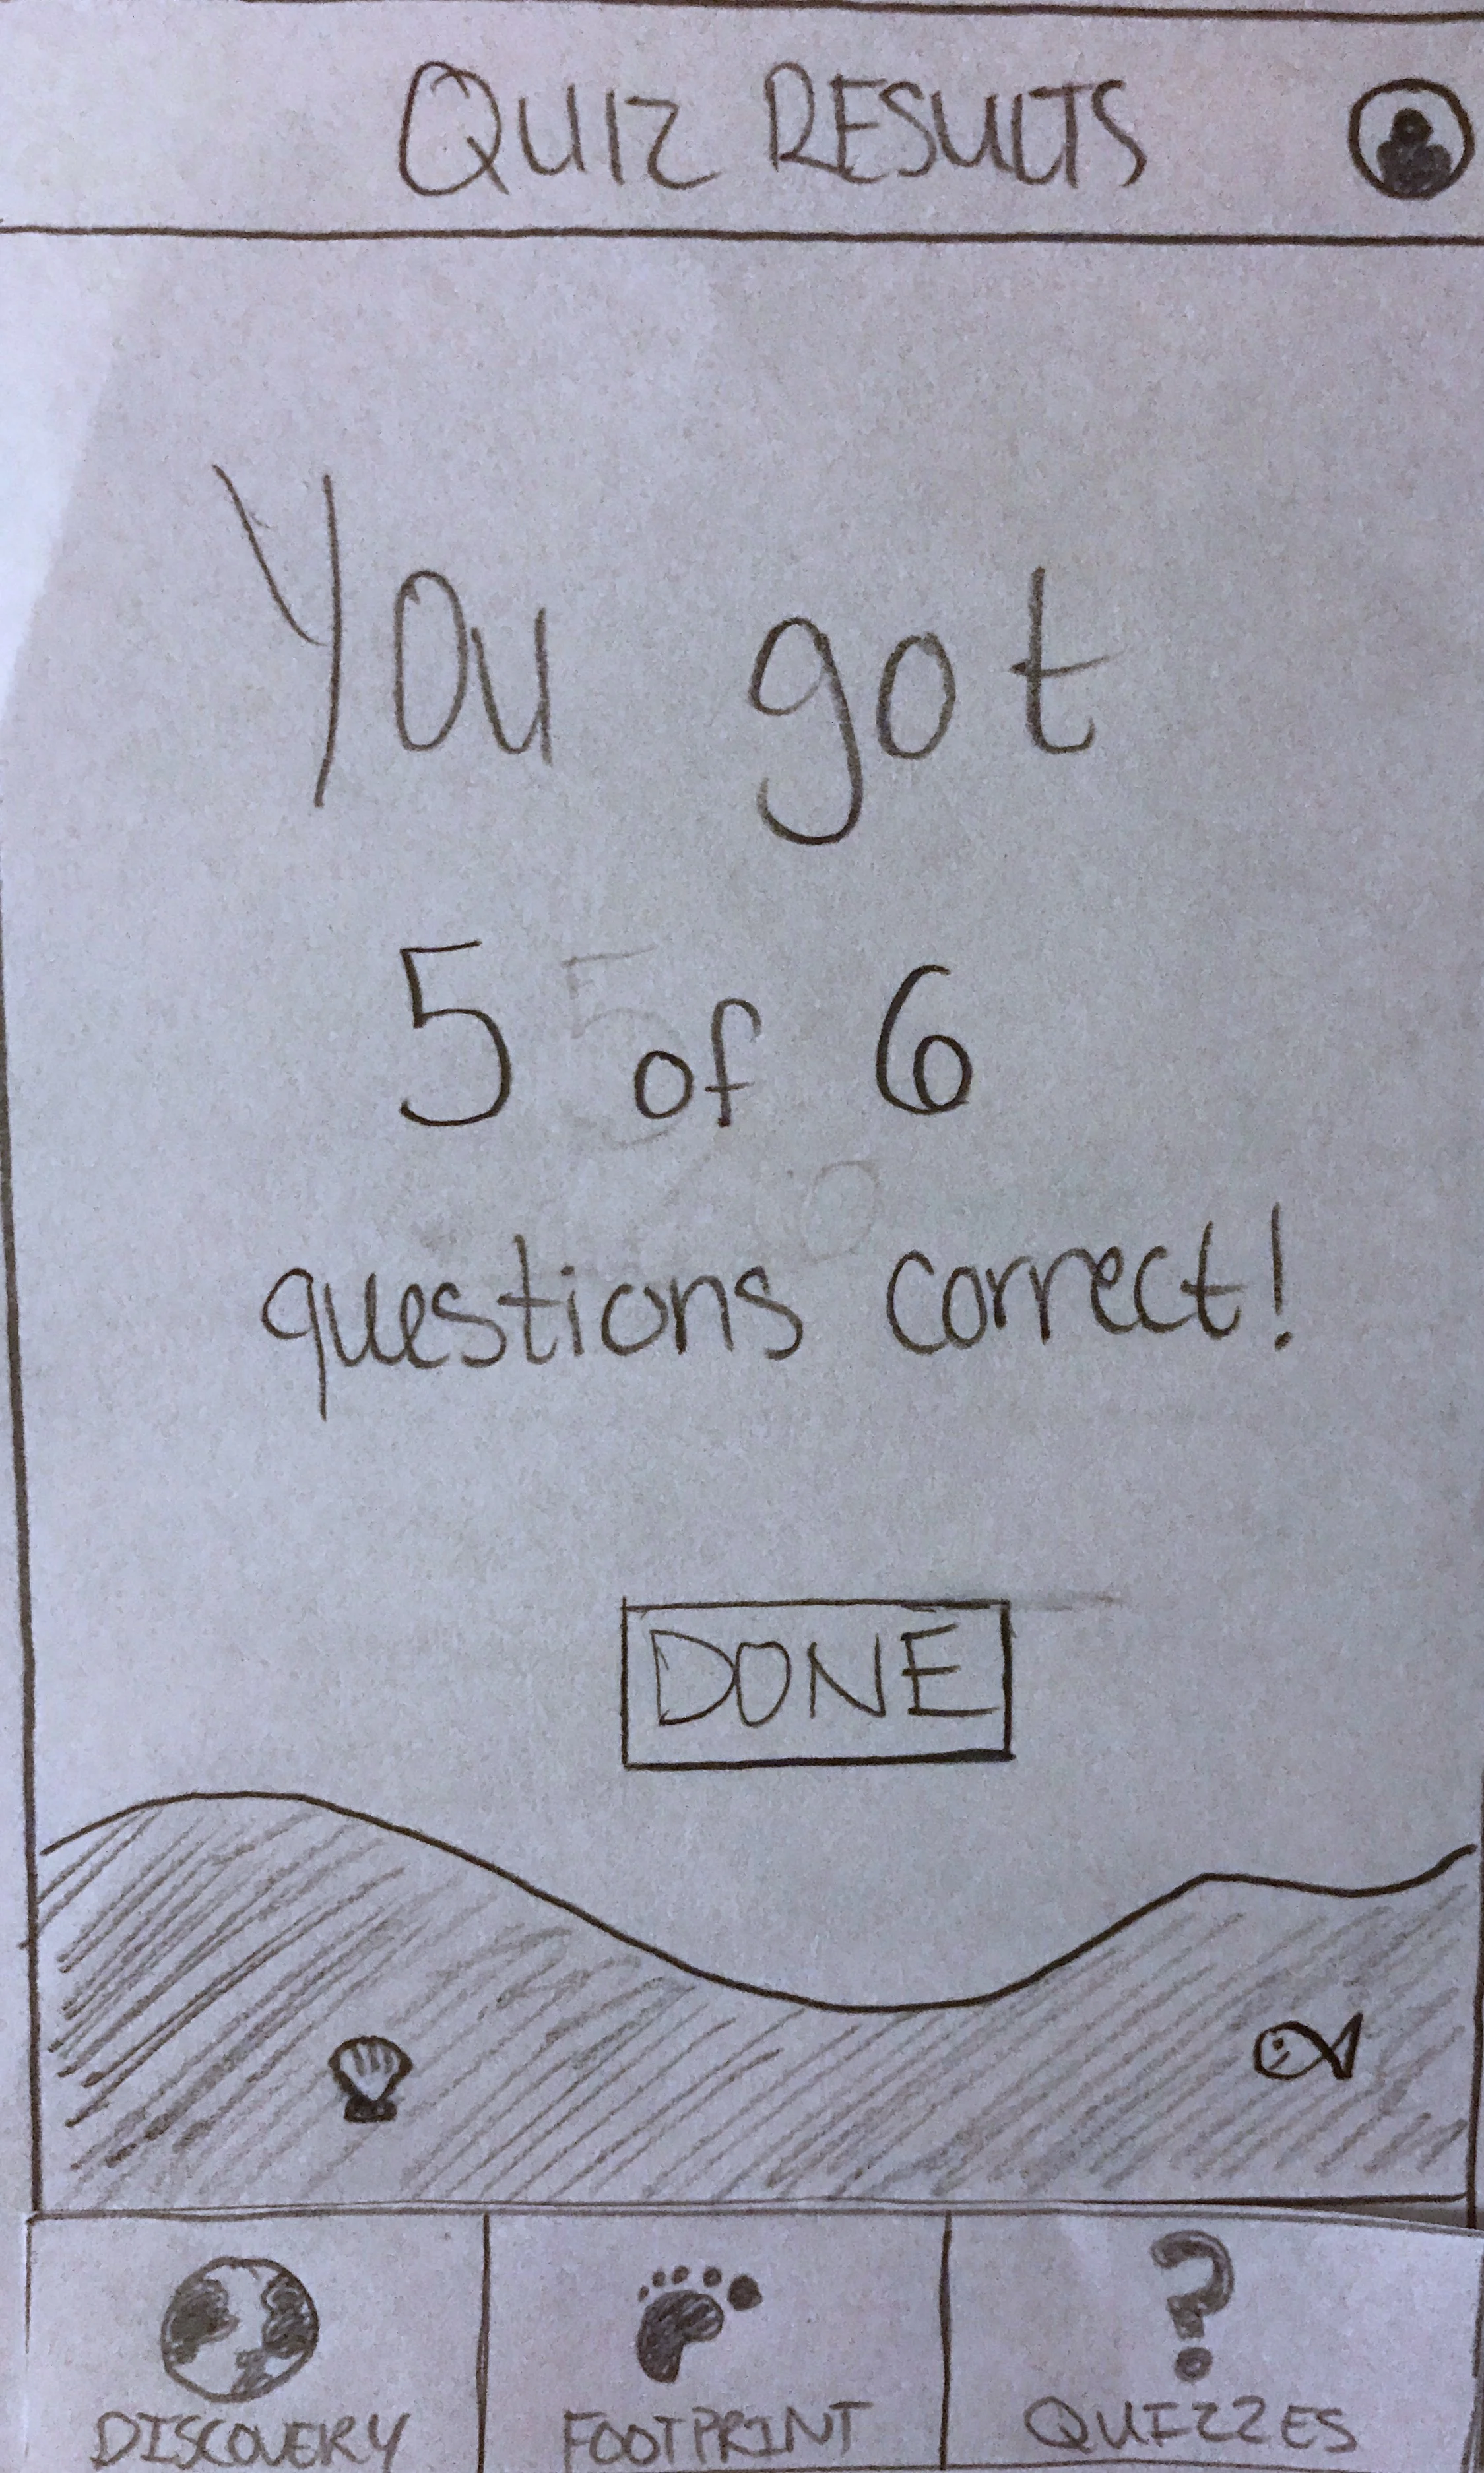
After submitting an answer, users are shown a correct or incorrect screen with details about why the correct answer is indeed the right answer. Displaying this additional information educates our users, who may have simply guessed the right answer, about why certain answers are wrong or right compared to the others listed. After finishing a quiz, users are shown how many questions they answered correctly out of all the questions they answered so that they know how well they did overall.
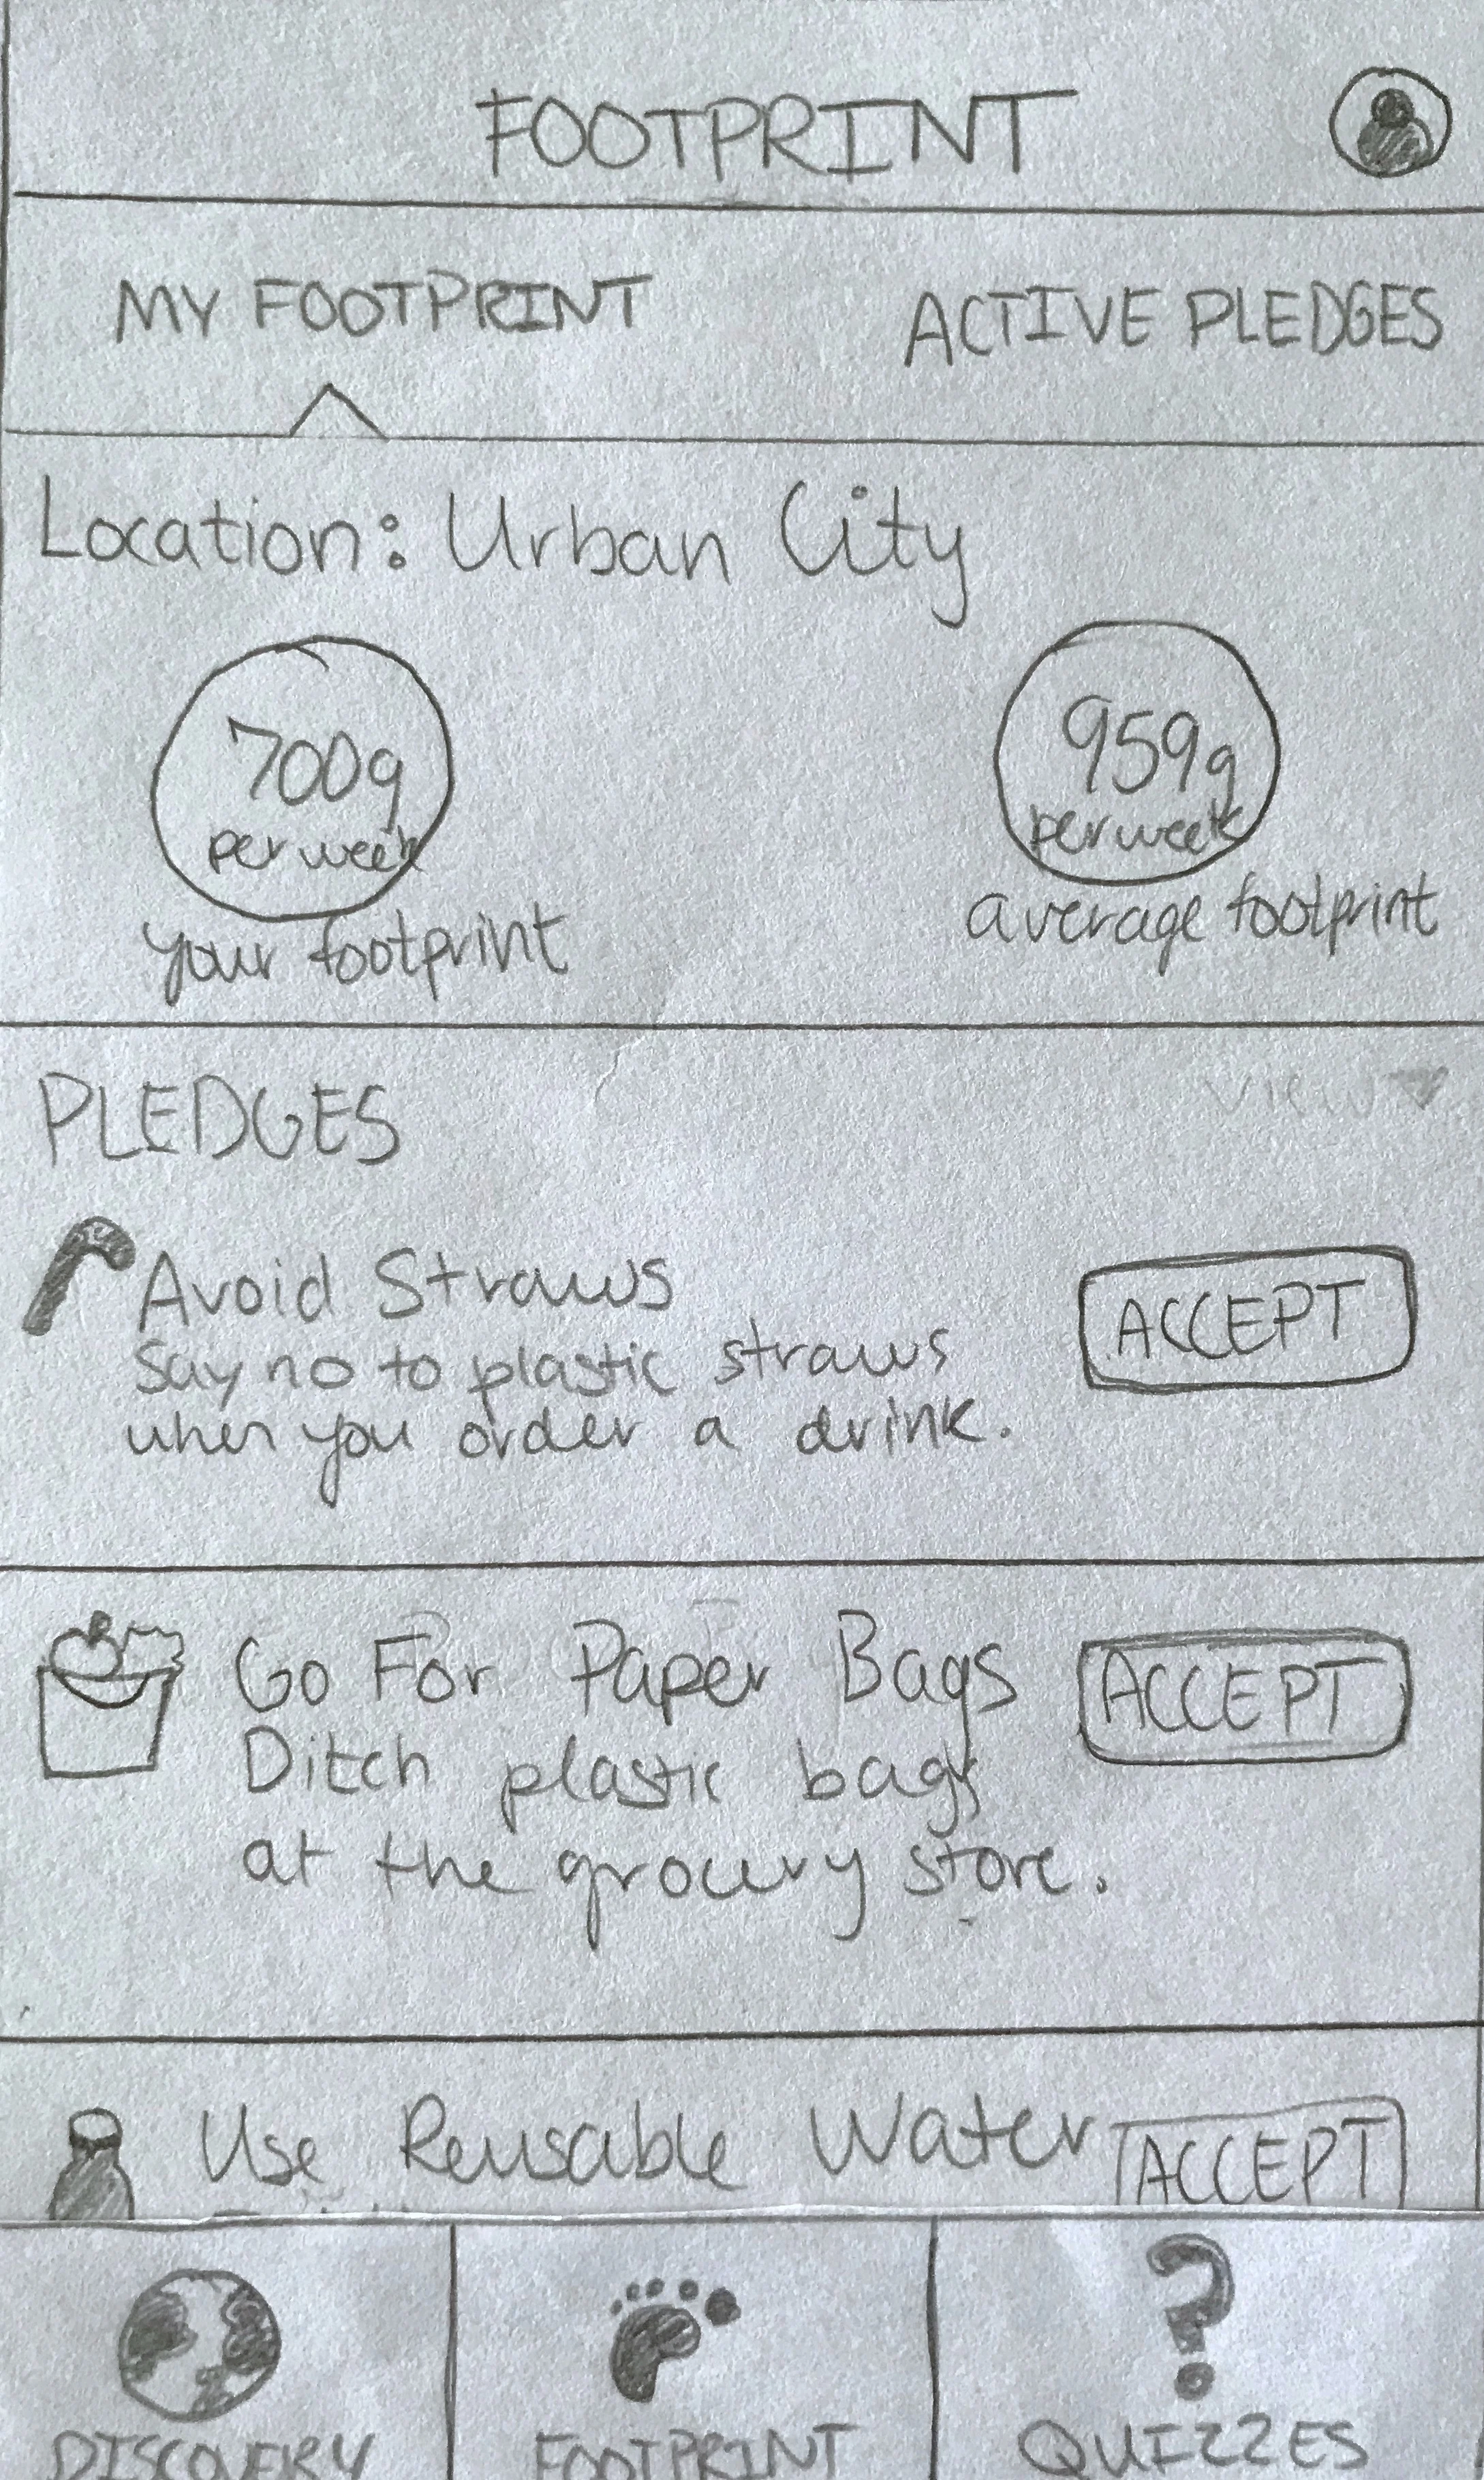
FOOTPRINT
While using the rest of our app to discover what plastic pollution is all about and how it affects the world, users can also explore their own plastic footprint right within the app itself as well. A user's beginning average footprint is based on the location type (urban, suburban, or rural) that they provided upon sign up. If a user wishes to lower their plastic footprint, they can accept pledges to see how using less plastics in their life can change the overall size of their footprint. A smaller plastic footprint can be achieved by using less straws or plastic bags for example.
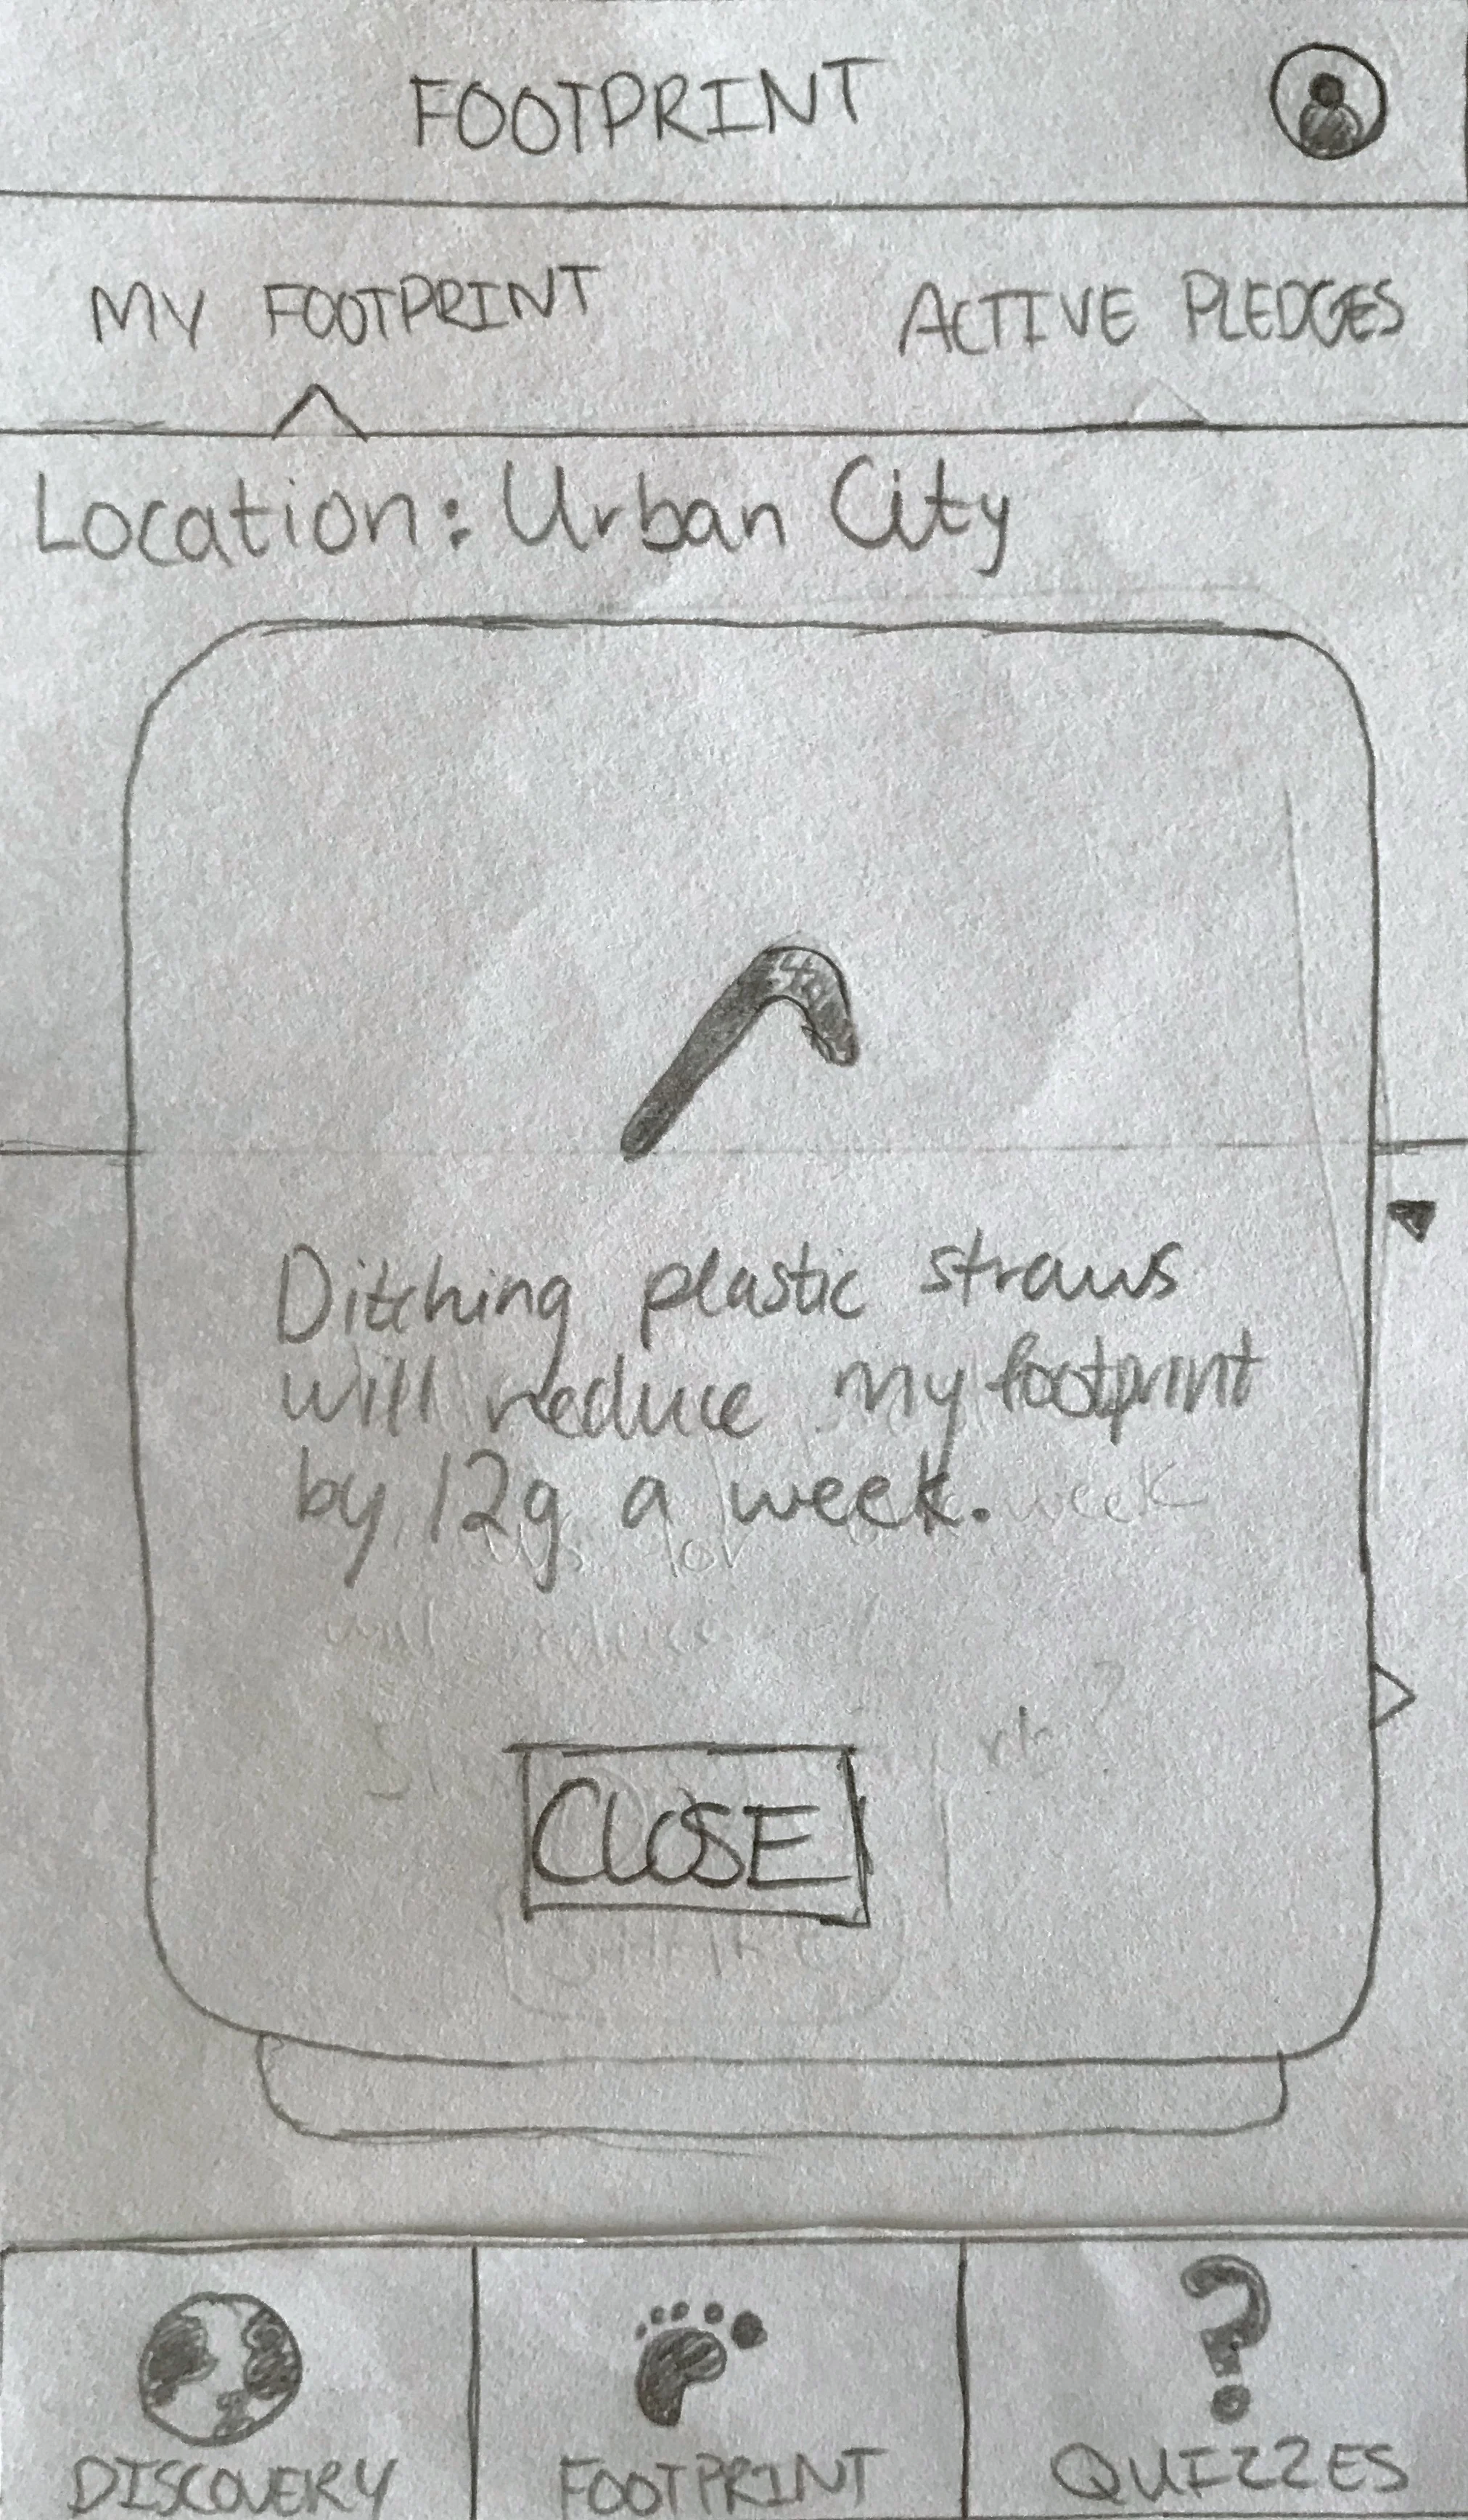
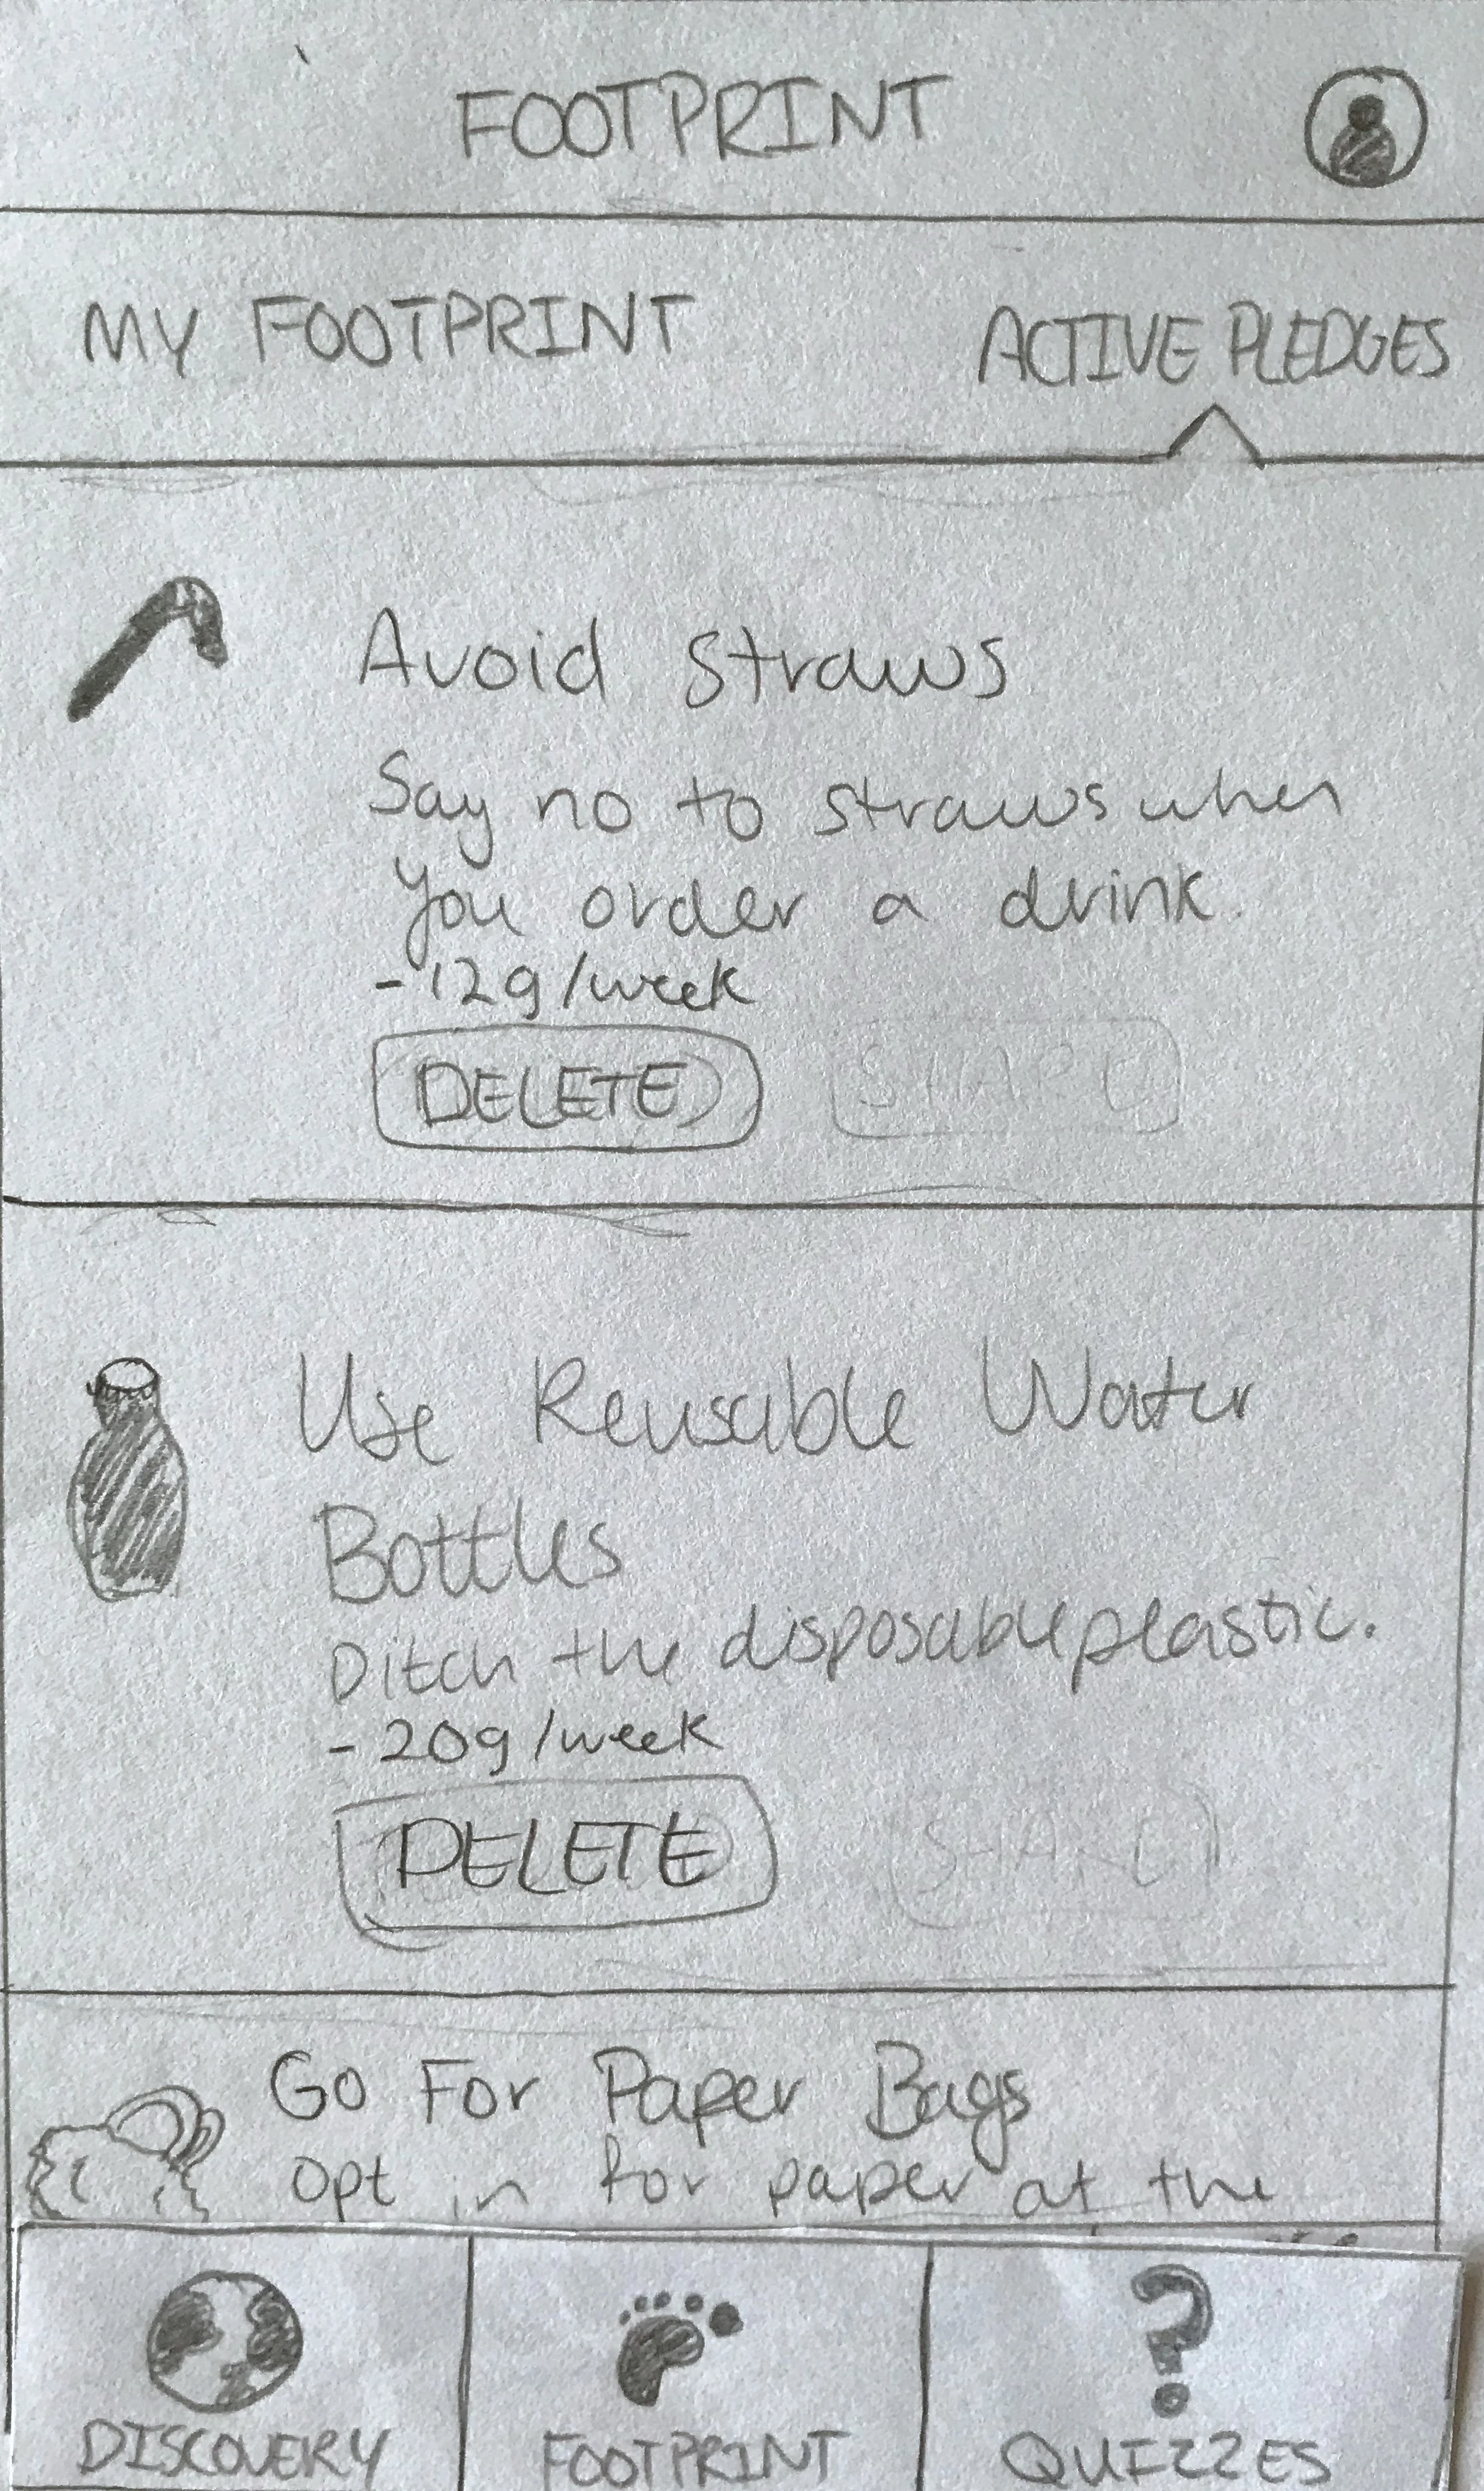
Every pledge that a user chooses to accept prompts them to estimate how many of that particular item they aim to avoid or it informs the user of the effect of switching out plastic bottles for a reusable one for example. Users can also see their currently accepted pledges from the active pledges tab where they can see how much each pledge is taking off their plastic footprint every single week.

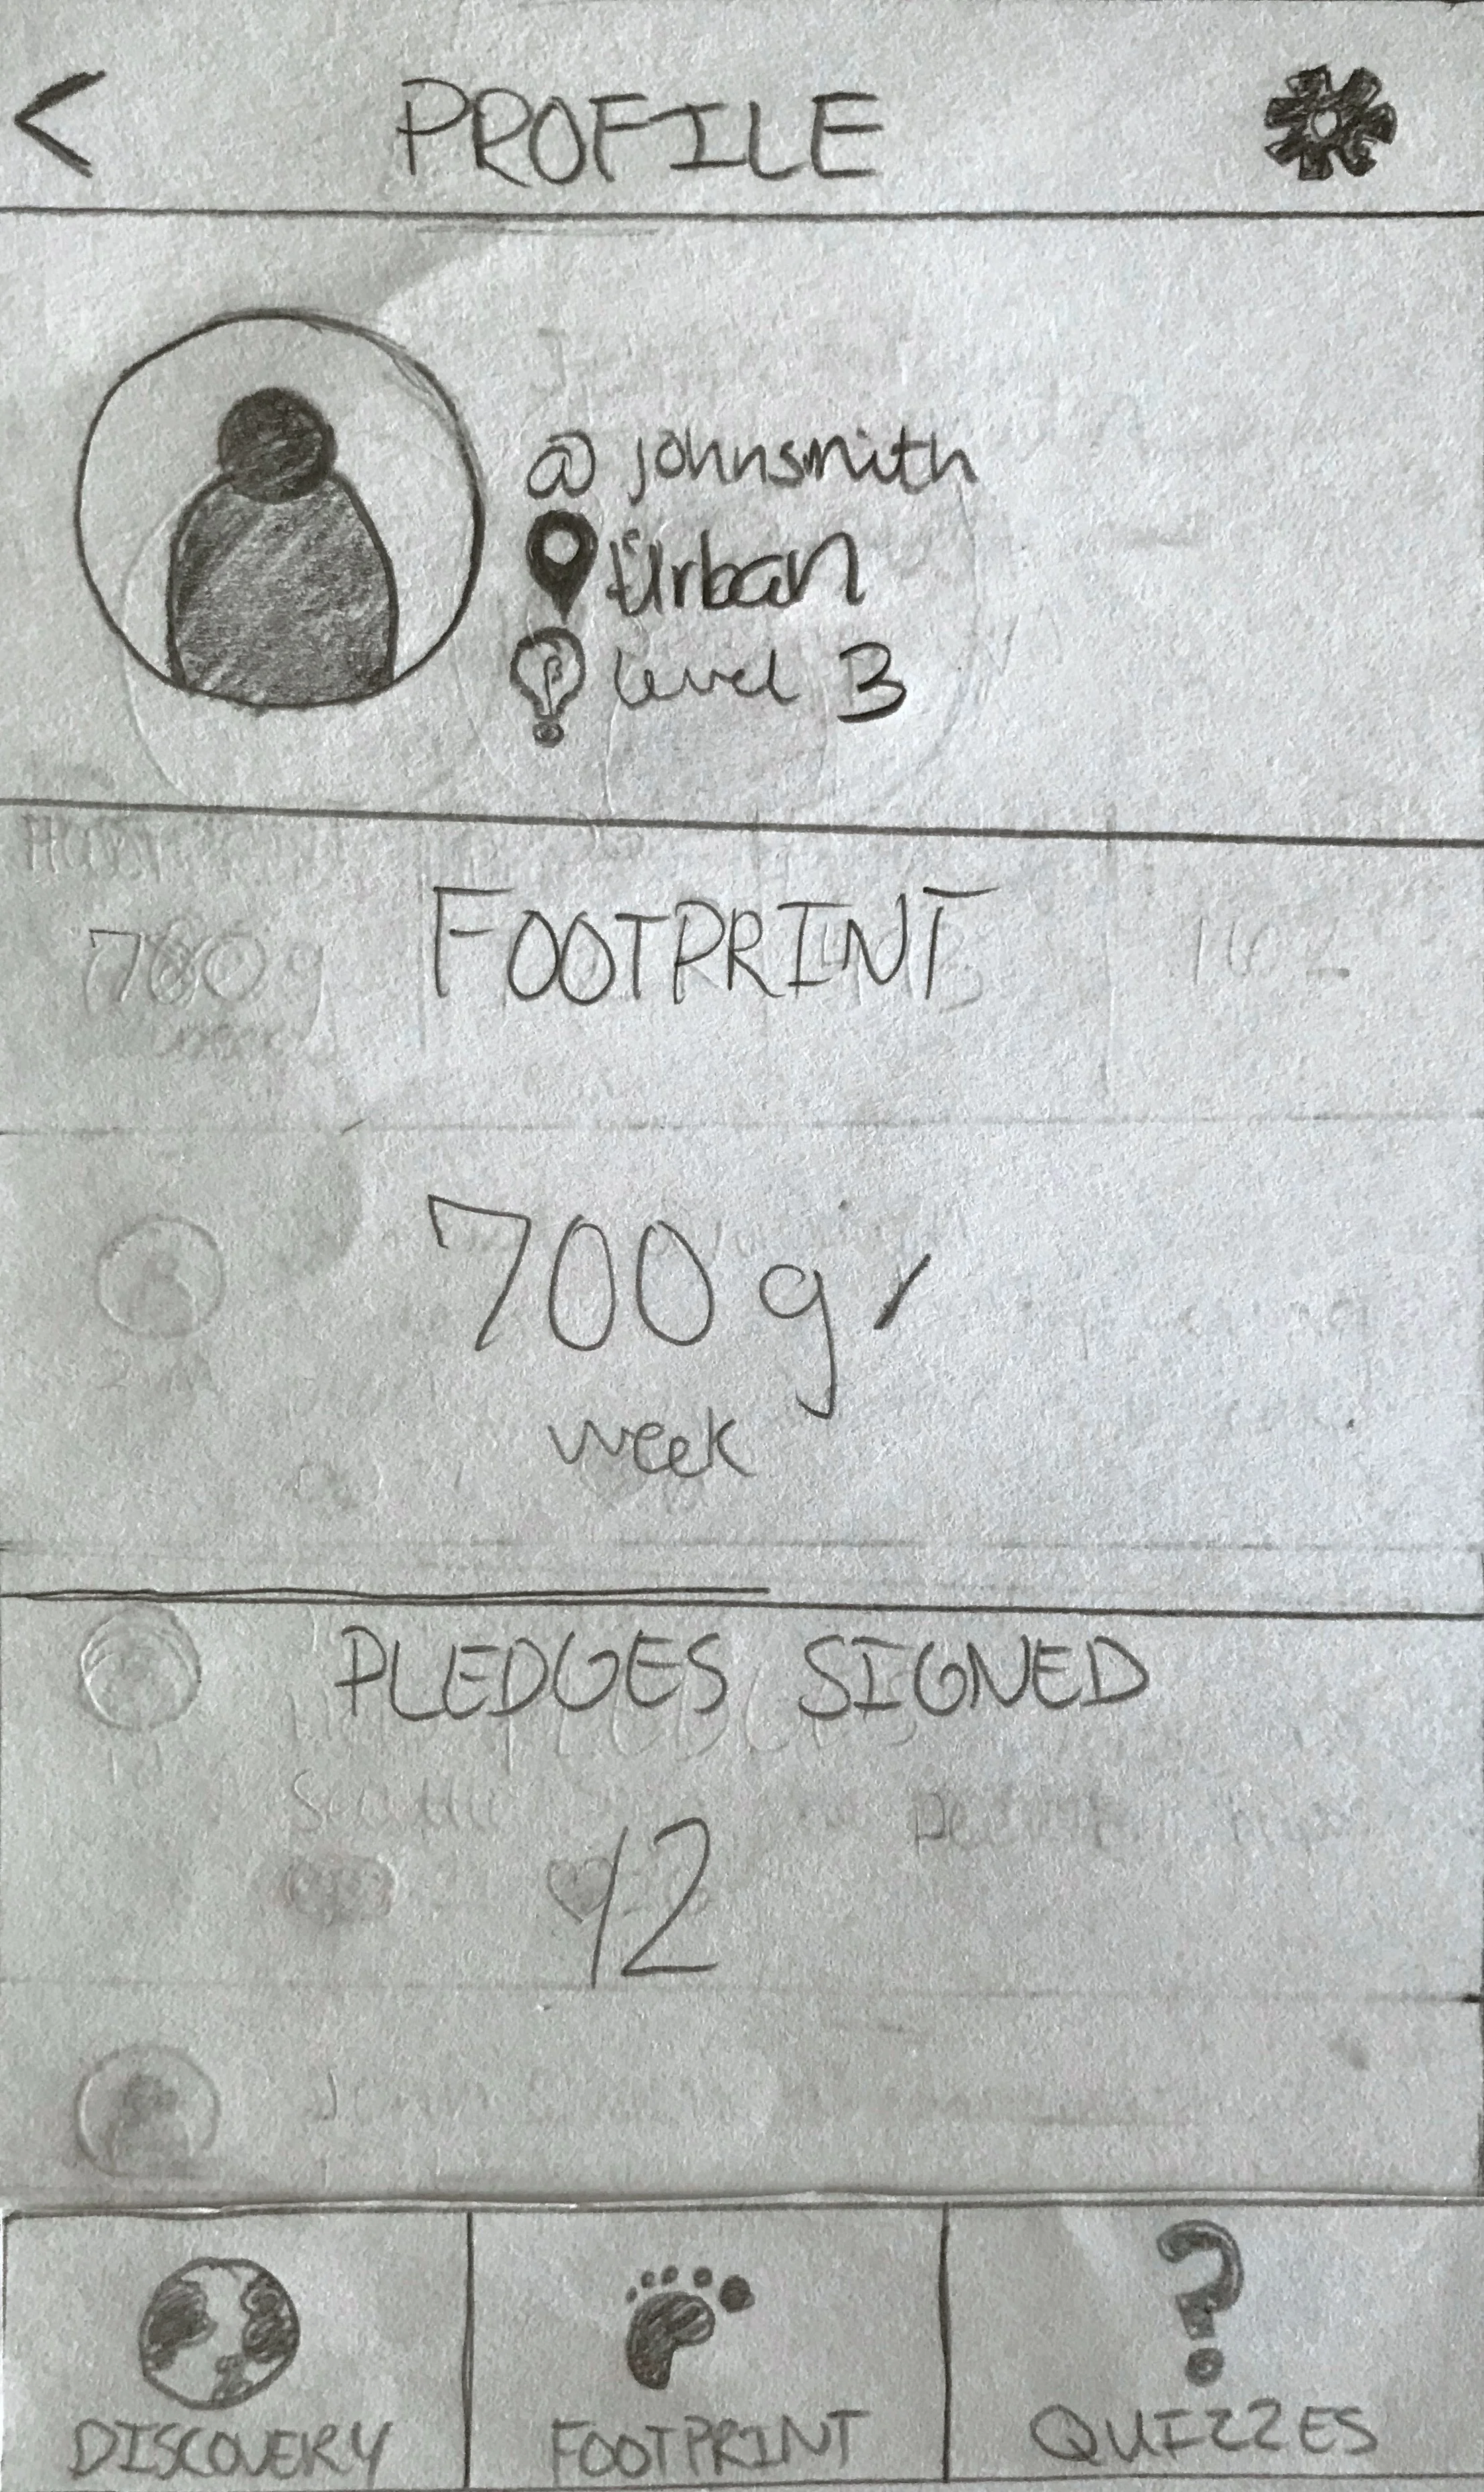
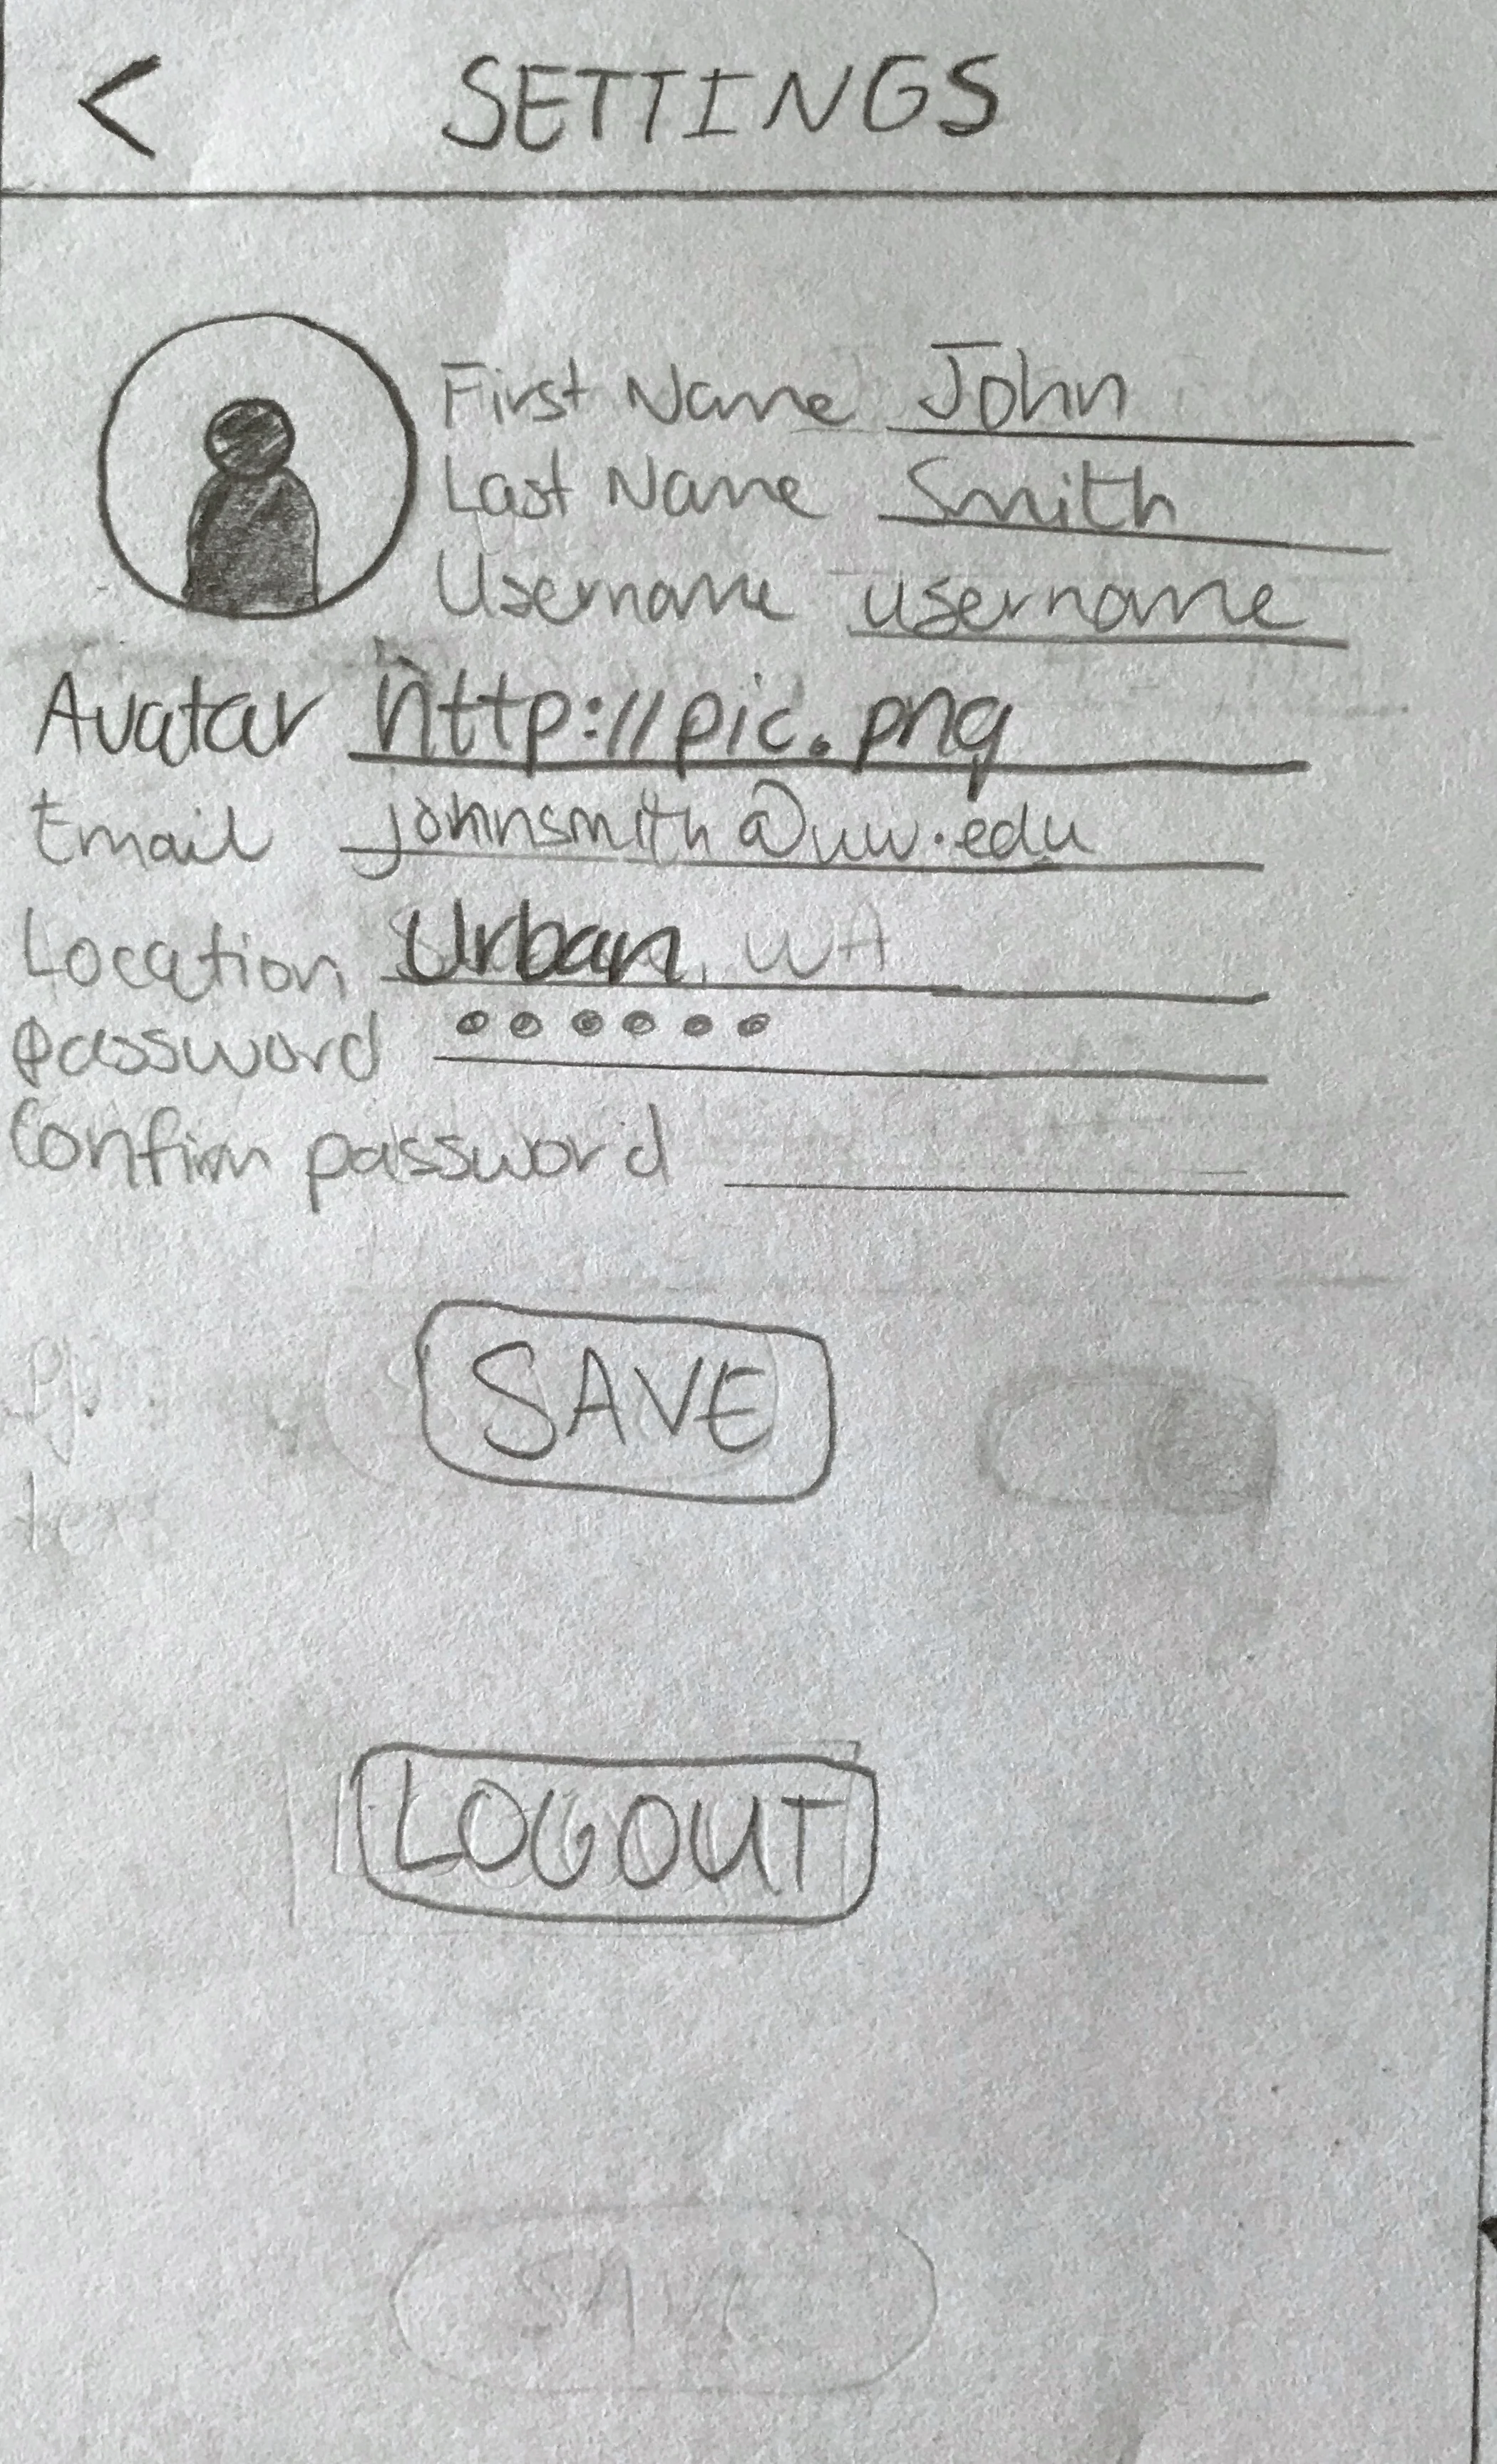
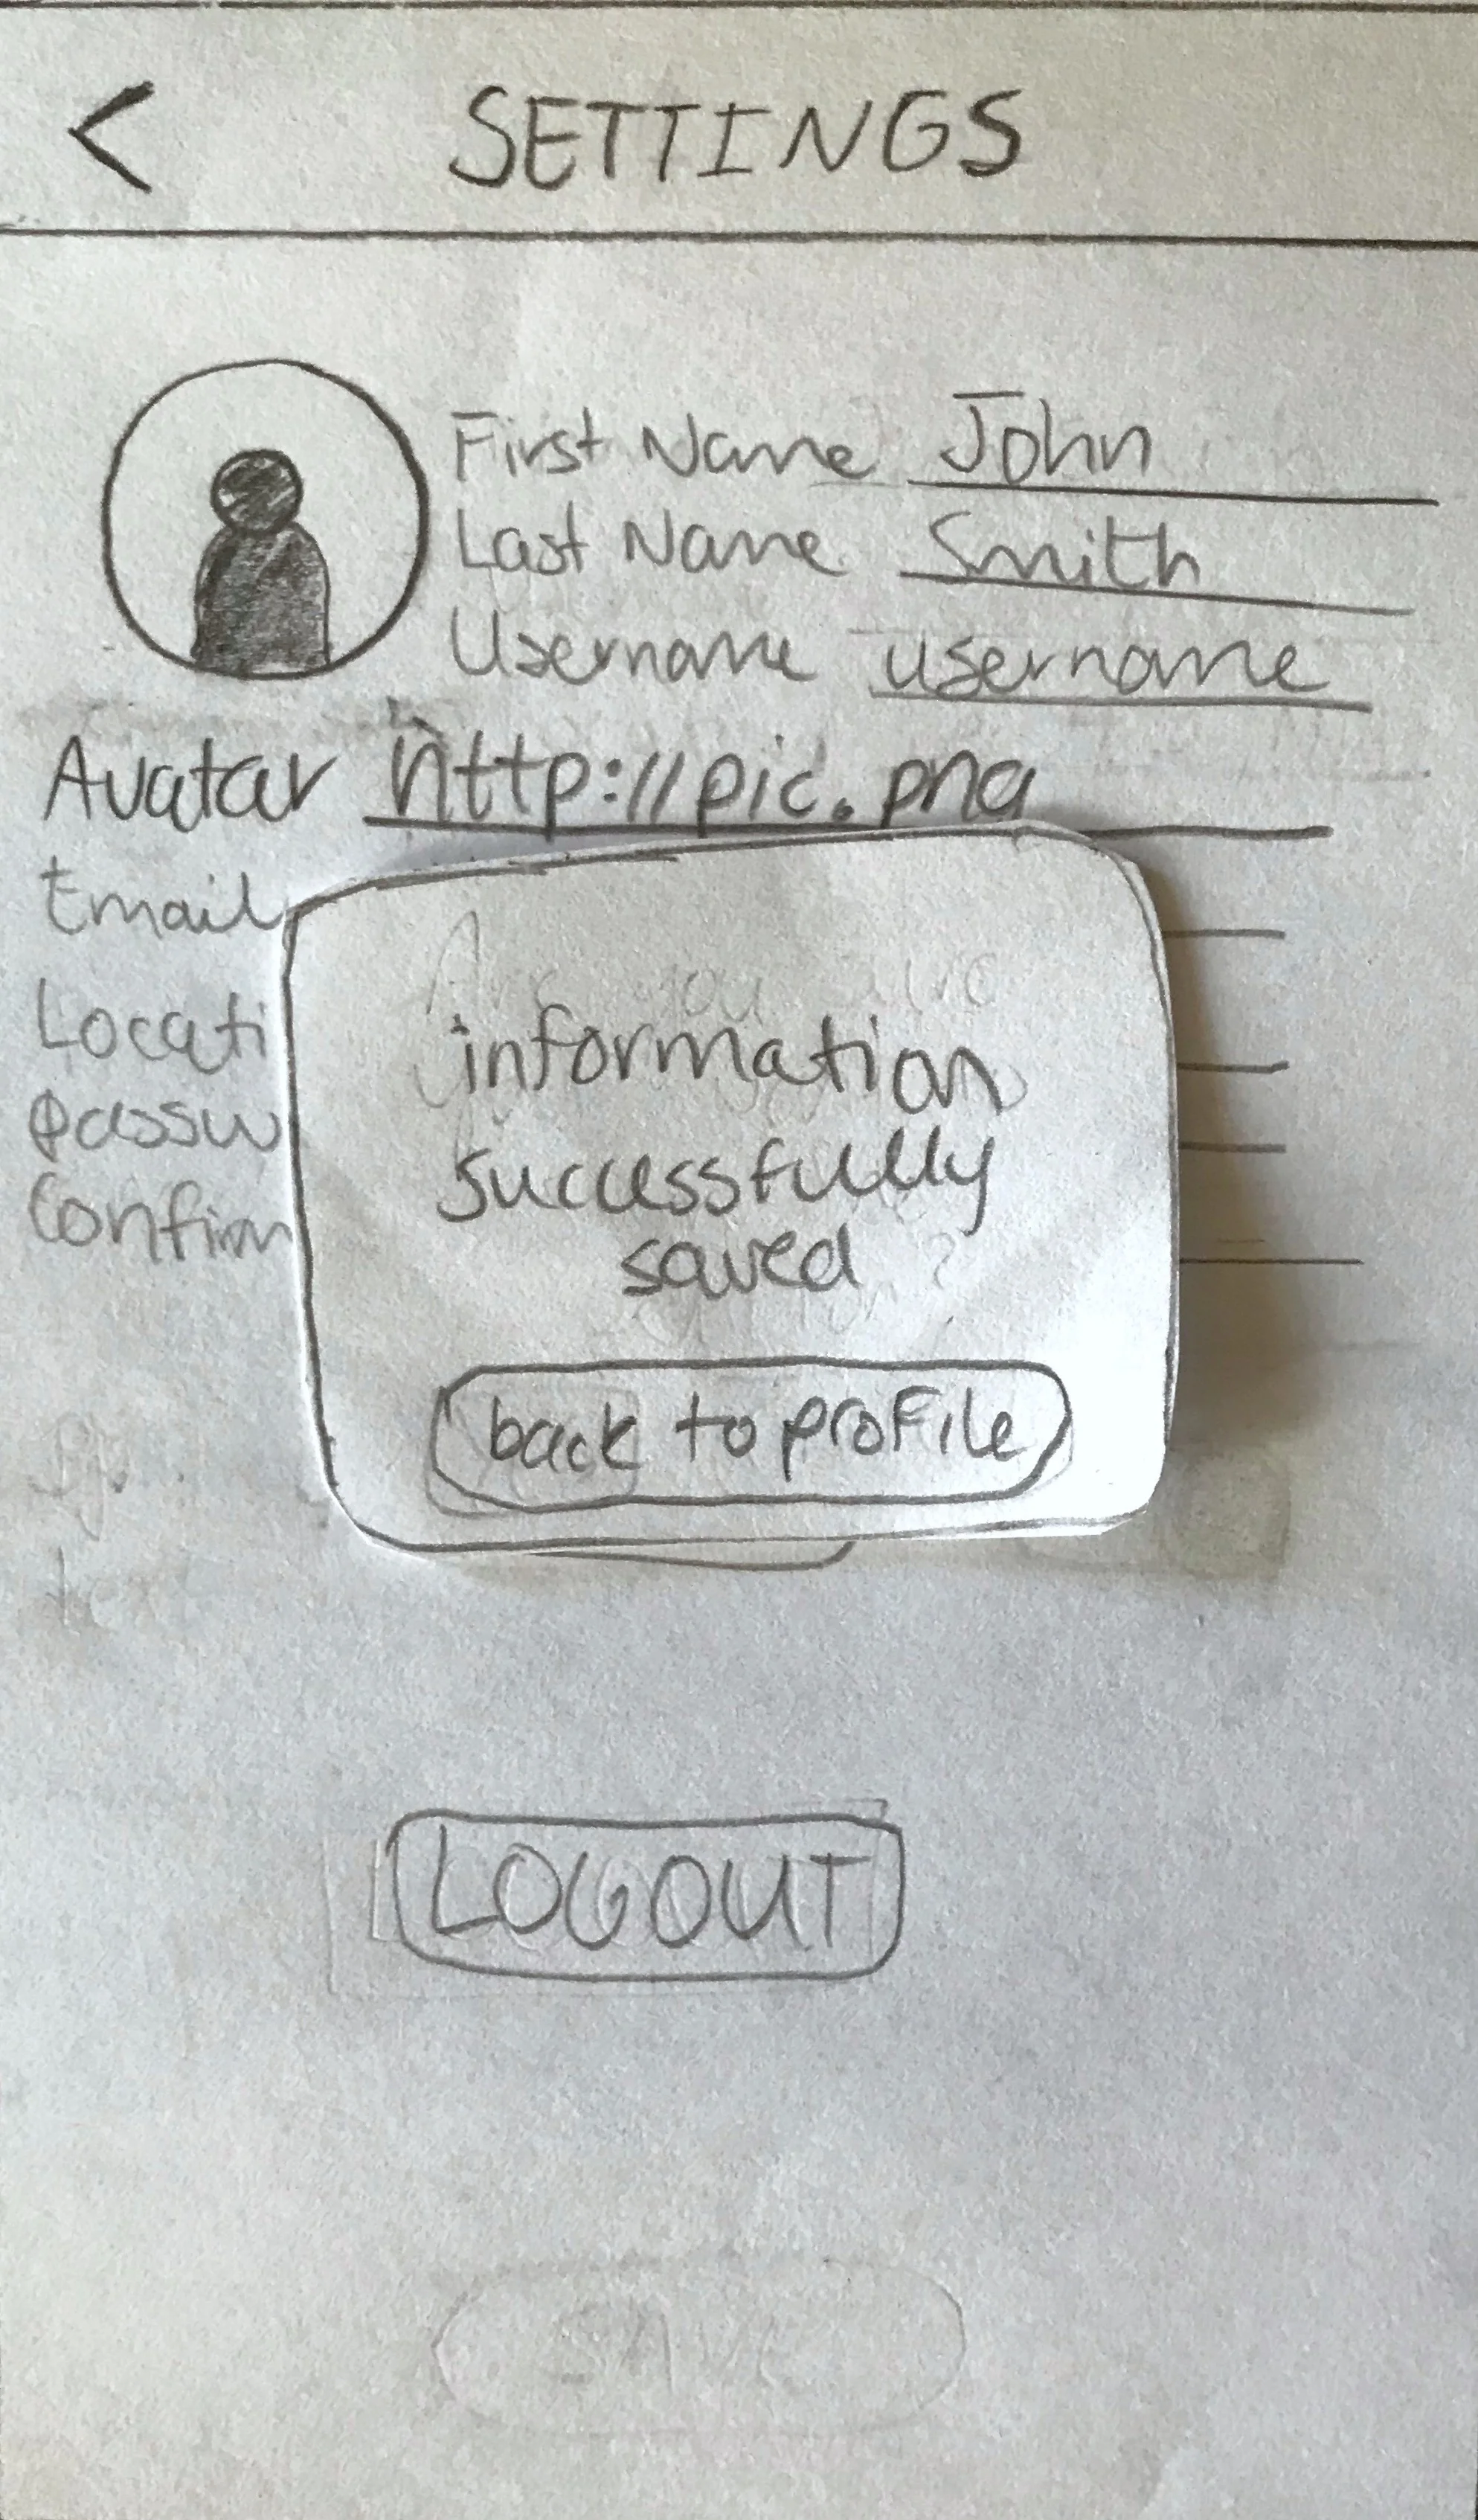
PROFILE
Users can visit their profile to see their current progress on Plastic Oceans, such as their quiz level, their current weekly plastic footprint, and the number of total pledges they have signed. Profiles help users keep track of how well they're accomplishing their own goals in one convenient location. The settings page allows users to change their personal details so that they always have control over what information they are sharing with Plastic Oceans.
DEVELOPMENT
Plastic Oceans was built with the React.js library because it allowed us to encapsulate each section of the website into its own independent component. This way each part of our website could handle its own data without the need to know how other components are processing its own data and information. React also allowed us to show users content from a page before it was completely done loading, which proved to be tremendously helpful in instances where we used data sets that took a few seconds to load. Instead of waiting on a blank screen to finally display content, we could instead update our users on new data as soon as the browser received it without forcing them to refresh to see these changes.
We also used Boostrap for our CSS framework because it had UI components that matched the minimalistic and modern style we wanted to achieve with our final design. Bootstrap included most of the elements we needed to use throughout our application and allowed us to stick with a cohesive design throughout.
CLASS REQUIREMENTS
Due to the constraints and requirements of INFO 461 (Cooperative Software Design), we were only given a week to design our application completely. Once the final design was created, all aspects had to be incorporated exactly as our sketches outlined when the final product was developed in order to achieve full points on our assignment. This left no room to change details or components based on new things we learned from our users and therefore we could not improve the user's experience after this finalization without penalization.
Although, since we had created a design specification and a requirements specification, our team of developers had strong guidelines on how the final product should look and work without any confusion.
SIGN IN & SIGN UP
Opening up Plastic Oceans for the first time brings the user to our home page that encourages users to sign up because our mobile web app will give them the tools they need to reduce their own plastic footprint. We incorporated a blue and purple color scheme because these cool colors mimic the ocean and help users more closely associate the things they learn from our app to the same topic.
Both the sign in and sign up forms function relatively the same as they both include real-time error checking. This way users always know as they're typing whether or not their input is valid or invalid. This prevents users from being able to press the submit button and potentially losing all of their input since the submit button is disabled until all errors are fixed. Successful submissions are recorded in our Firebase database, which handles all of our authentication and secruity for us.
Plastic Oceans' home page entices users to sign up with its cool color scheme and pictures depicting sea life.
DISCOVER
The discover section of Plastic Oceans was the most challenging part of development because the map was implemented using D3. Since both React and D3 manipulate the DOM in their own ways, D3 proved to be difficult to use because the map wouldn't automatically update its displayed content when the discover component updated its state with new map data, which was caused by the browser window being resized. The inconsistency between the data the map showed and the data that the component was actually able to access caused the map to have both outdated popovers and inaccurate map markers. This problem was solved by forcing the browser to refresh when the browser resolution changed. The trade off of forcing the user's page to visibly refresh was acceptable to ensure that the map markers were in the correct locations and contained the appropriate data.
In order to retrieve the data for the discover map, we used the Fetch API to easily convert the web response into JSON, which could then be read by our application. All of the trash collected at a single coordinate (rounded to four decimals places) was grouped together in order to make the map easily readable by users. Tapping on any circle, which is labeled with a number denoting the total amount of trash collected there, brings up a popover which also groups together the different types of trash that was found. This information educates users on the typical types of trash that are usually incorrectly disposed of within that area.
Users can discover what part of the world's coastlines accumulate the most trash and see the most commonly found items at that location as well.
FOOTPRINT
A user can check their current plastic footprint from the footprint section of Plastic Oceans. A person's average footprint is calculated based on the location they gave upon sign up and is used in all future calculations based on claimed pledges. The number shown is the amount of plastic, in grams, that they use and dispose of weekly. On the my footprint tab users can claim additional pledges and decide the amount of impact they believe they will make weekly. Being able to customize and estimate their own weekly reduction in areas such as the amount of plastic bags they use, tailors the app to that particular user and their desires.
The active pledges tab is where users can check the pledges they've currently vowed to carry out every week. Although, if they've changed their mind, they can simply delete the pledge and discover what their new plastic footprint would be without the pledge. All of this information is stored within Firebase.
A user's plastic footprint fluctuates depending on the types of pledges they've signed and the commitment they've voewed to make to each pledge.
Committing to a pledge is simple and easy and shows users what kind of impact they can start making weekly.
QUIZZES
Quizzes is the section of Plastic Oceans that tests users' knowledge about plastic pollution and its effect on the planet. Rather than pulling this data from a JSON file, all of the data in the quizzes was scraped from various websites and then uploaded to our Firebase database for easy access. Database queries in this case are faster and more efficient than pulling from a JSON file would be.
A user's score for each quiz is recorded in Firebase and is only updated if they score higher on the latest quiz that they take. Quizzes are also only marked as completed if the user reaches the results page to ensure that they take the entire quiz in one sitting. Navigating away from quiz or refreshing the page causes the user to restart from the beginning.
The answers to each of the questions is also randomized every time a quiz is taken so that users actually learn what the correct answer is rather than always knowing it appears in the same spot (A, B, C). This ensures that users are taking the time to understand why the answers to certain questions are in fact correct. Also, whenever a user answers a question, they are provided with a learn more link to further understand why the answer is correct and to become more aware of issues they might not be familiar with. Their incorrect answer is provided if they answered the question wrong so they know what answer they choose in order to learn from this mistake in the future.
Quizzes not only test a user's knowledge, but also educates them as well on issues that they may be unaware of.
PROFILE
With profiles, users are able to see a summary of their current progress from a single page. Users can see how well they're doing on quizzes by seeing their level, which increases by one with every 100% they receive, and how small or large their plastic footprint is relative to the number of pledges they've signed. With a summary, users are always kept up to date on how well they're doing, which can prompt them to make more life style changes if they want to further reduce their weekly plastic footprint.
The settings page ensures that users can update their personal information as it changes and even remove information they are no longer comfortable sharing with Plastic Oceans.
Profiles are a great way to summarize a user's current efforts towards reducing their plastic footprint and becoming educated on plastic pollution.
TESTING & SUPPORT
Before we deployed Plastic Oceans, we verified that all of the features were working as intended. This included both manual and automatic testing, which is described here:
After Plastic Oceans was deployed to the public for the first time, our team was responsible for fixing all bugs and errors that occurred within the first 24 hours. Since I focused primarily on developing the sign in/sign up forms and the discover map, those were the areas that I devoted the most time towards when fixing bugs.
All errors were reported via GitHub issues and had to be closed within 24 hours of being reported. We were responsible for explaining to users why certain issues were not considered bugs or why a certain issue couldn't be fixed. If an issue was successfully fixed, we were also responsible for explaining to the owner of the issue what we did to mitigate the problem and how the feature now worked to accommodate these changes.
REFLECTION
Designing and developing Plastic Oceans proved to be more difficult than any of our team could have imagined on day one. Since this class required us to map out every feature, design detail, and piece of architecture in complete detail, we quickly discovered how hard it is to ensure that all of these different documentations match and don't contradict each other. As each document was constructed, we began to realize that the previous document contained ambiguities and wasn't as clear as we initially thought it was.
Although, this experience taught me first-hand that clear communication between designers and developers is critical in ensuring that the final product can actually be developed within the skill set of the developers. Clear communication also ensures that the developers understand exactly how the designers intend a feature to function and even what it should look like in the final product.
In the end, our entire team appreciated the long hours we put into all of the documentations because it left no question unanswered during the final weeks of development.